
Digital Resilience Pays Off
Download this e-book to learn about the role of Digital Resilience across enterprises.

I’m pretty sure mine would say “Hey Bozo, thanks for drowning me to death” or “Must… have… water… What is this, the Sahara?” Oh, and also “I hate it here, what’s it take to get some morning sun?”
I decided it was time to apply my inner nerd to reduce my plants suffering. That and happier plants mean a happier fiancé. Enter Splunk! The goal was:
I shall call it… Operational Plantelligence! When first said aloud, I received a slow, sad head shake from the aforementioned fiancé. But alas, it did not deter me from the project.
I bought this kit to cultivate some technology-supported Redwood bonsais. The end result?
Let’s break this project apart and step through how I created this dashboard.
In this case, there are multiple IoT devices used to collect all of this machine generated data.
So, why Splunk? Sure, each data source offers its own app to view and analyze their particular data. But, Splunk let’s me combine and join these disparate data sources (and more!) over time to gain additional insights. With a composite view, I can do deeper discovery on what’s happening to my precious seedlings – moment-by-moment or over any period of time.
I see this pretty commonly in the IoT world today — whether it’s energy, manufacturing, agriculture, robotics, or healthcare. Sensors are created and Apps built to analyze those sensors for a specific purpose or use case. Call it fate, fortune, luck or a combo — Splunk was built to fill this gap before we even knew it would exist and before the IoT acronym was “so hot right now”.
Our customers are starting to find their greatest value in combining data across their enterprise to create Operational Intelligence – and we are stoked to innovate with you
Ok, enough of my absolute (yet totally reasonable) infatuation with Splunk….. let’s get to the fun stuff.
Starting with the PlantLink sensor: You can purchase these little guys from Amazon or maybe even make your own and save a buck. If you get a PlantLink, you’ll be able to obtain and view moisture sensor level readings on a continual basis and get reminders for when to water your plant with the included App. This is great, but would be better with more data!
I used the Add-On Builder from Splunkbase to create a simple Technology Add-on (TA) to pull data from PlantLink’s API at MY preferred rate.
Here is what that data looks like in Splunk:
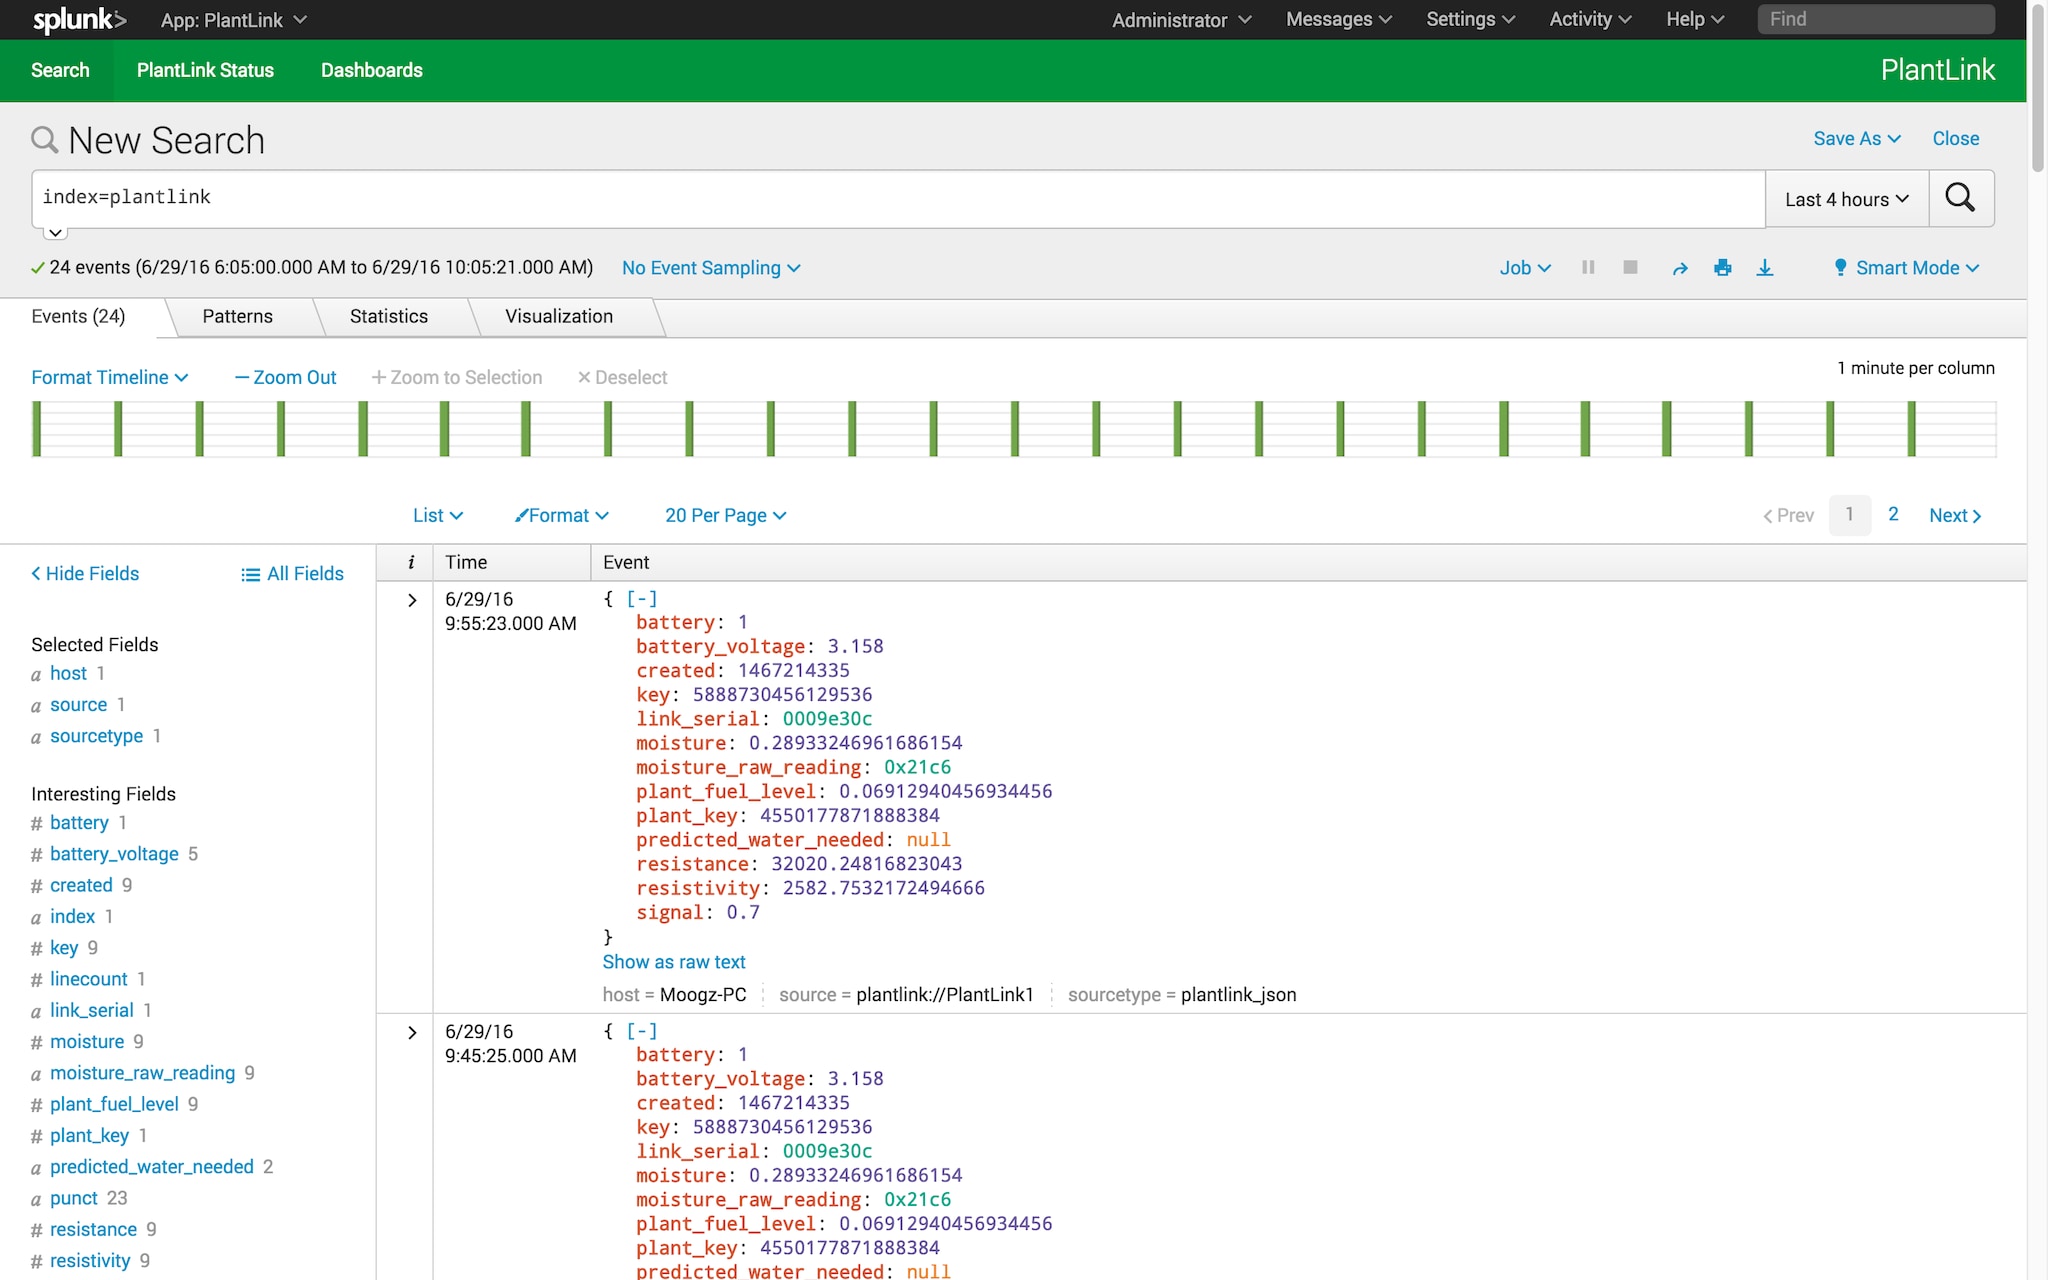
Hooray for nice clean JSON. How about the Thingsee data?
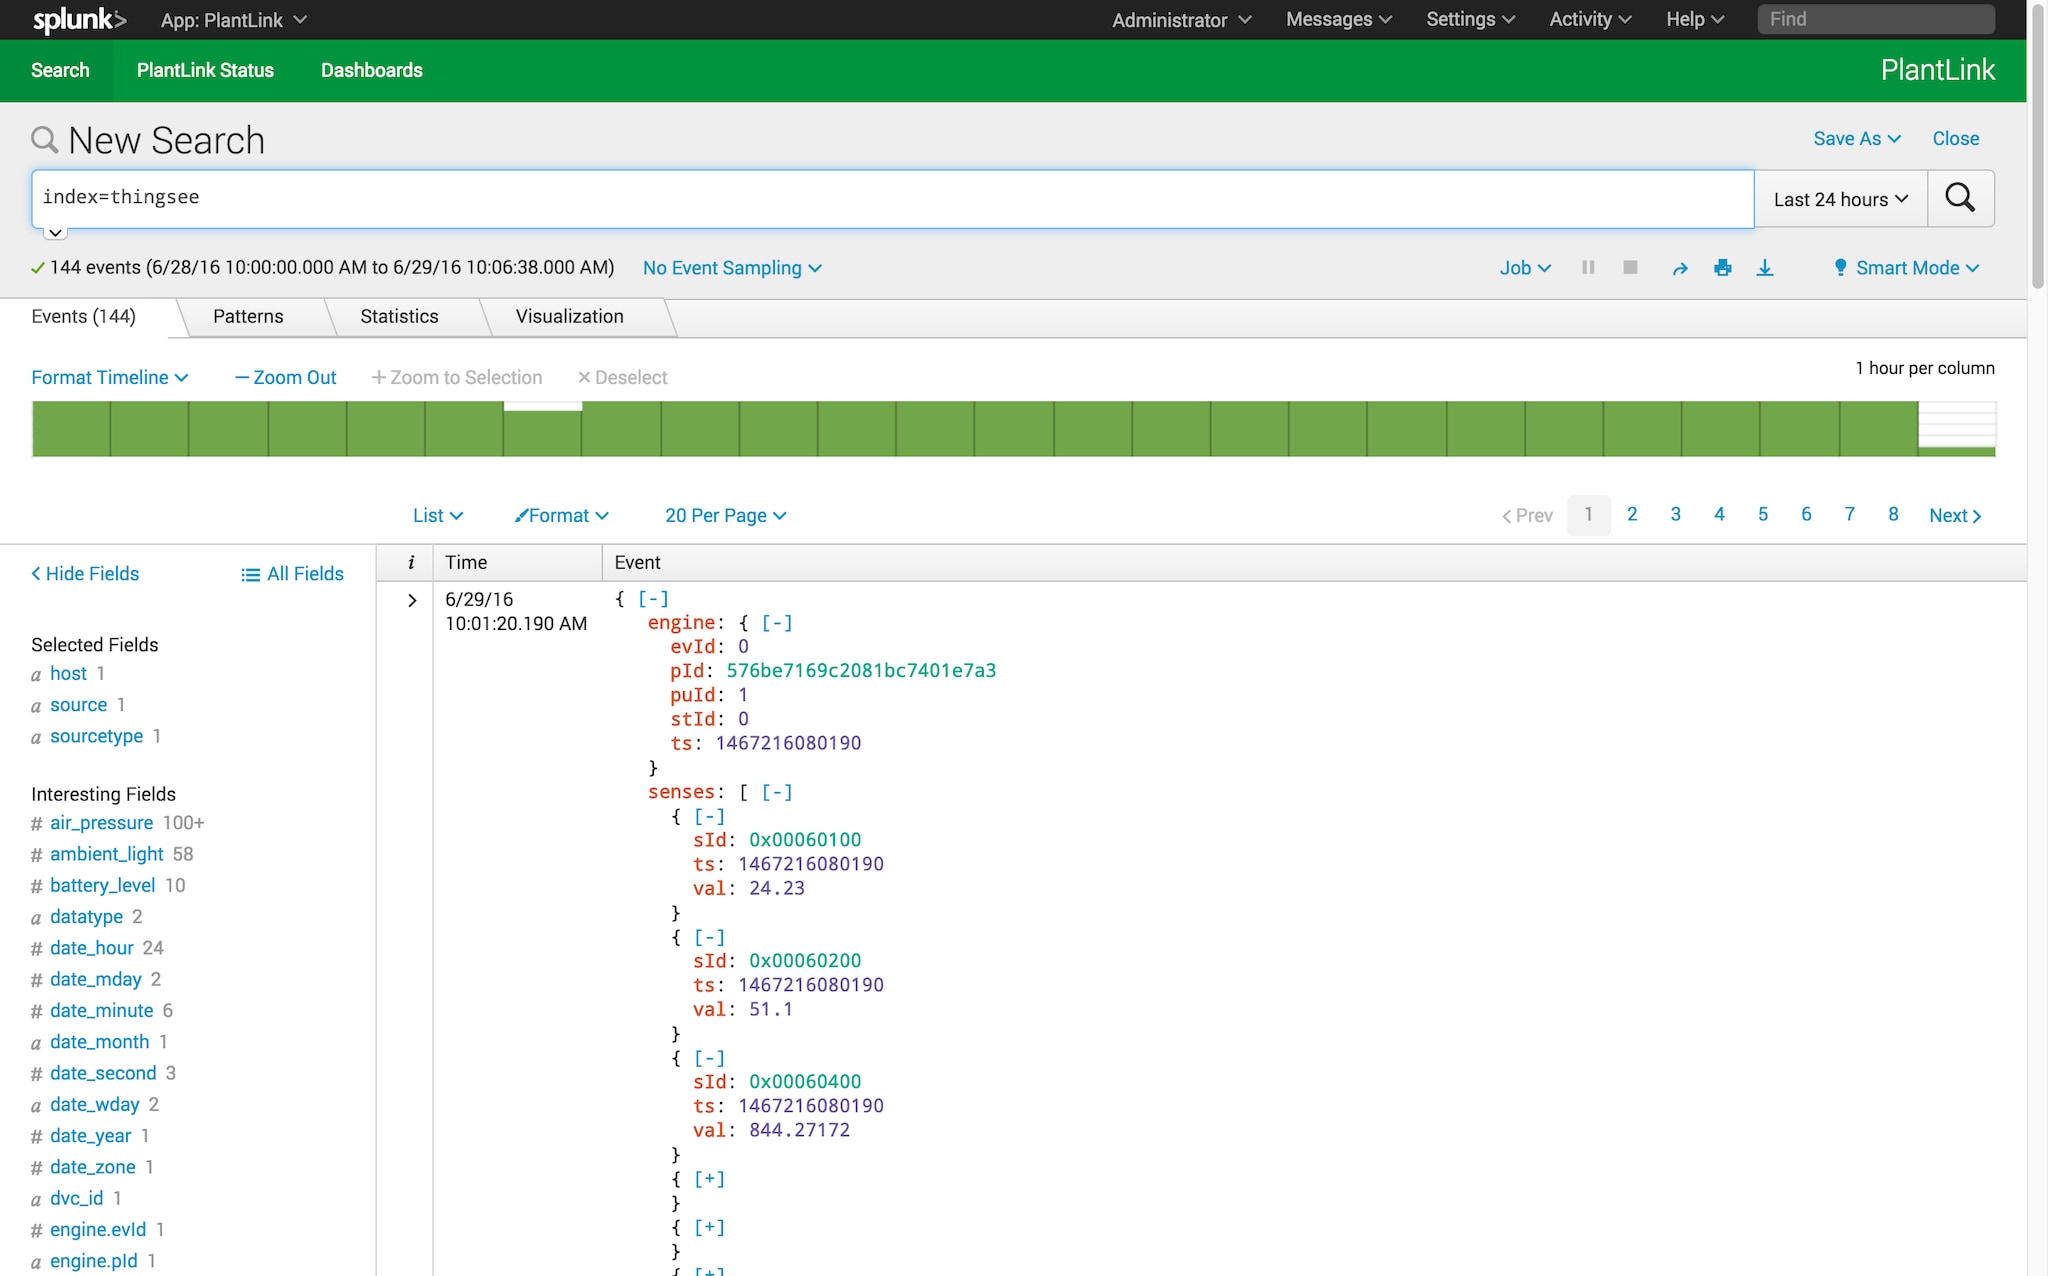
Well it’s in JSON, but a bit cryptic. Perfect time for lookup tables to make machine data more human readable. Even better, the lookup tables were already created by the community in an App! The same app assists you with getting data in from your Thingsee device. Gotta love it when there is so much out-of-the-box content available. Thank you Splunkbase!
As you can see, the lookup table takes the machine data and adds additional context to it, in real-time, making it much more usable. The “senses” are translated into fields such as “air_pressure”, “ambient_light”, “battery_level” and so on. Note that these lookup tables can be .csv files or a direct connection to a database.
Last but not least, we have our weather data from another app TA-wunderground.
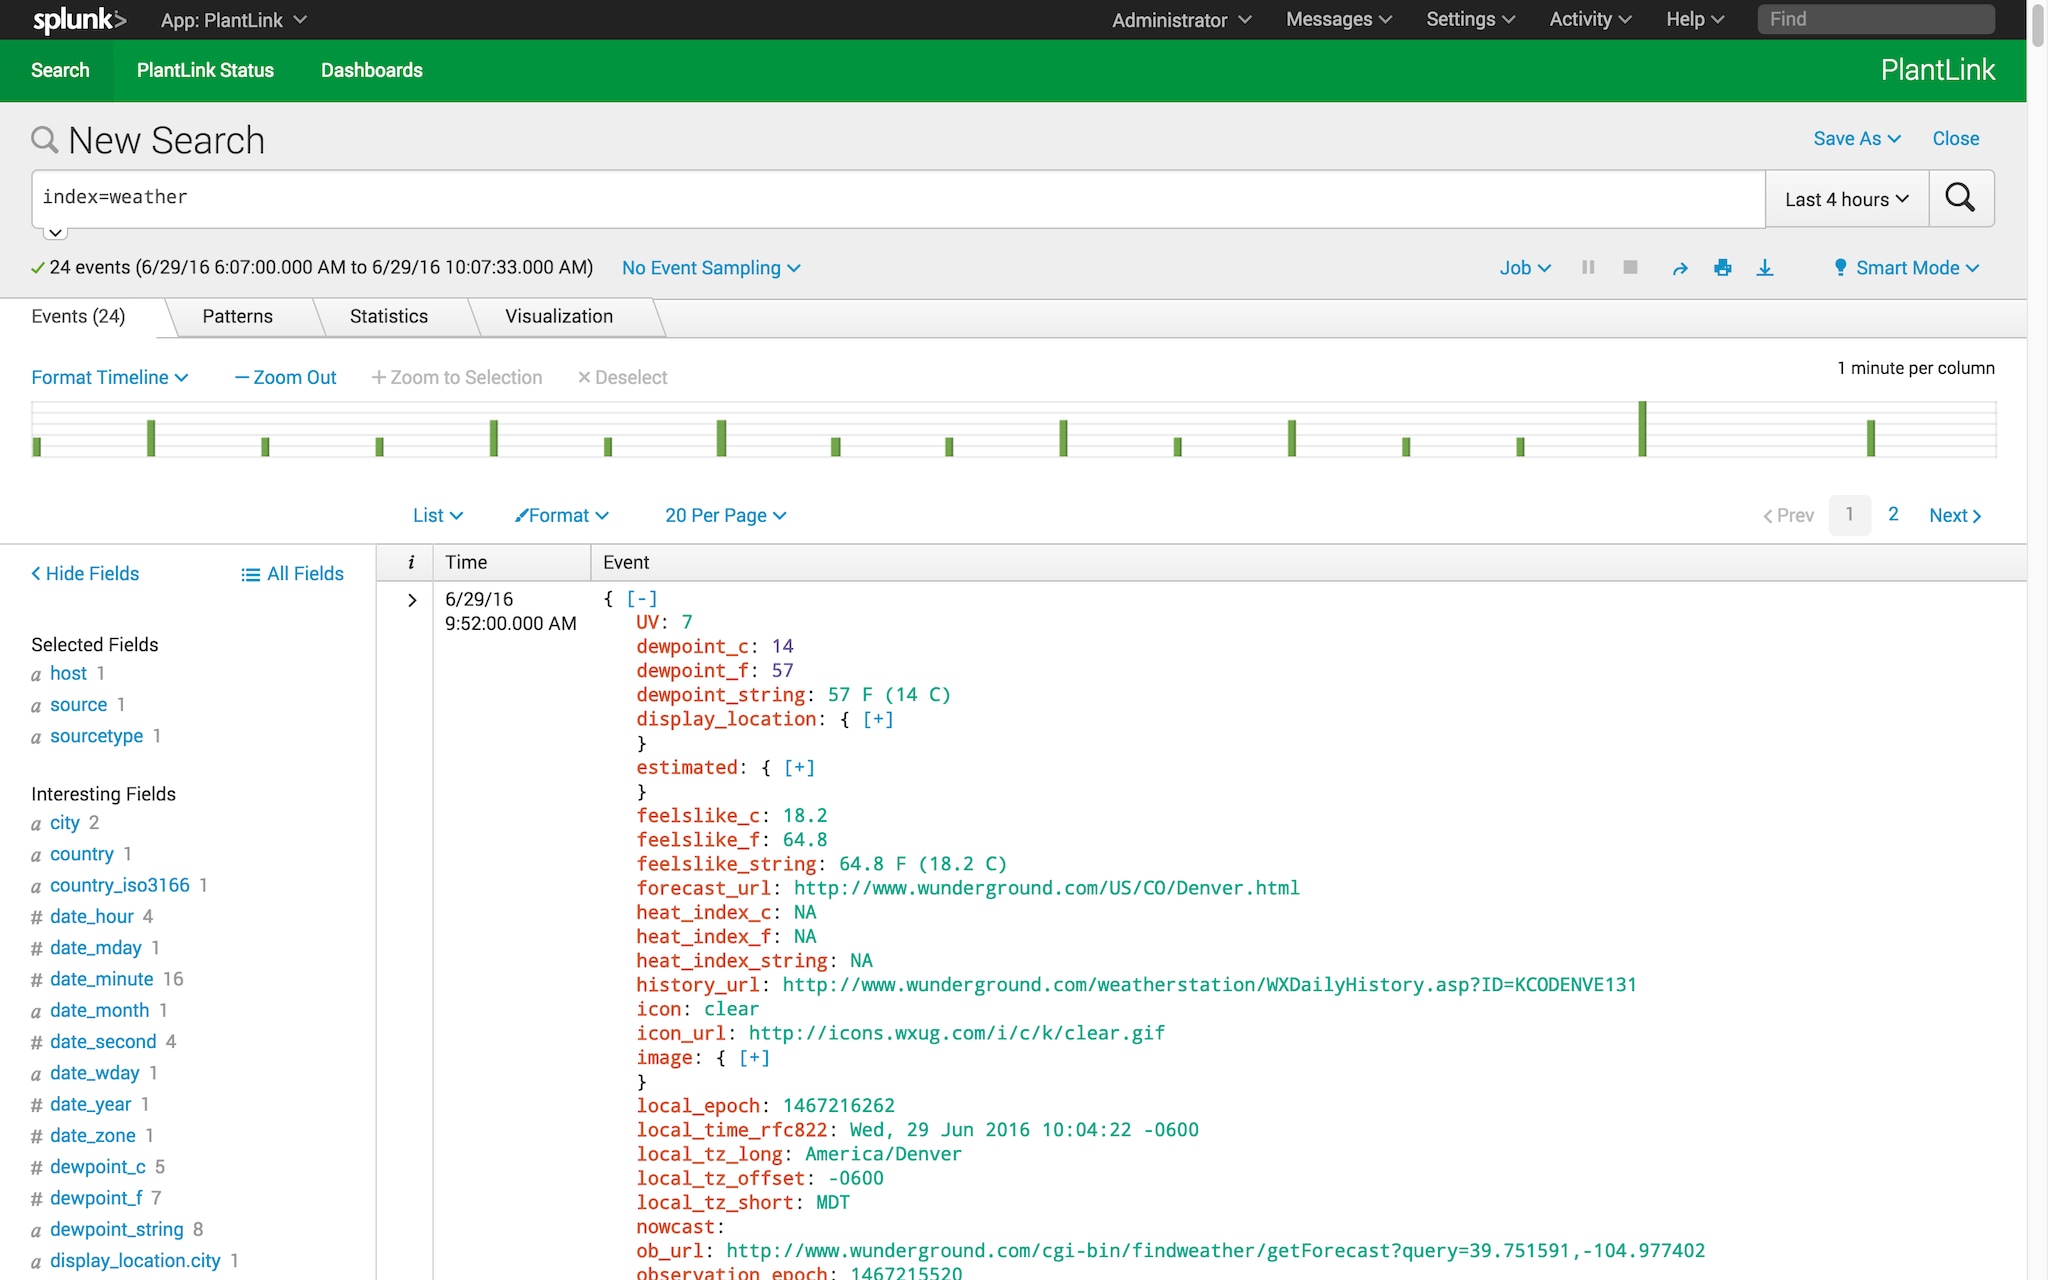
Again, must be my lucky day as it’s in JSON and the fields are automatically extracted by Splunk. (See fields on the left)
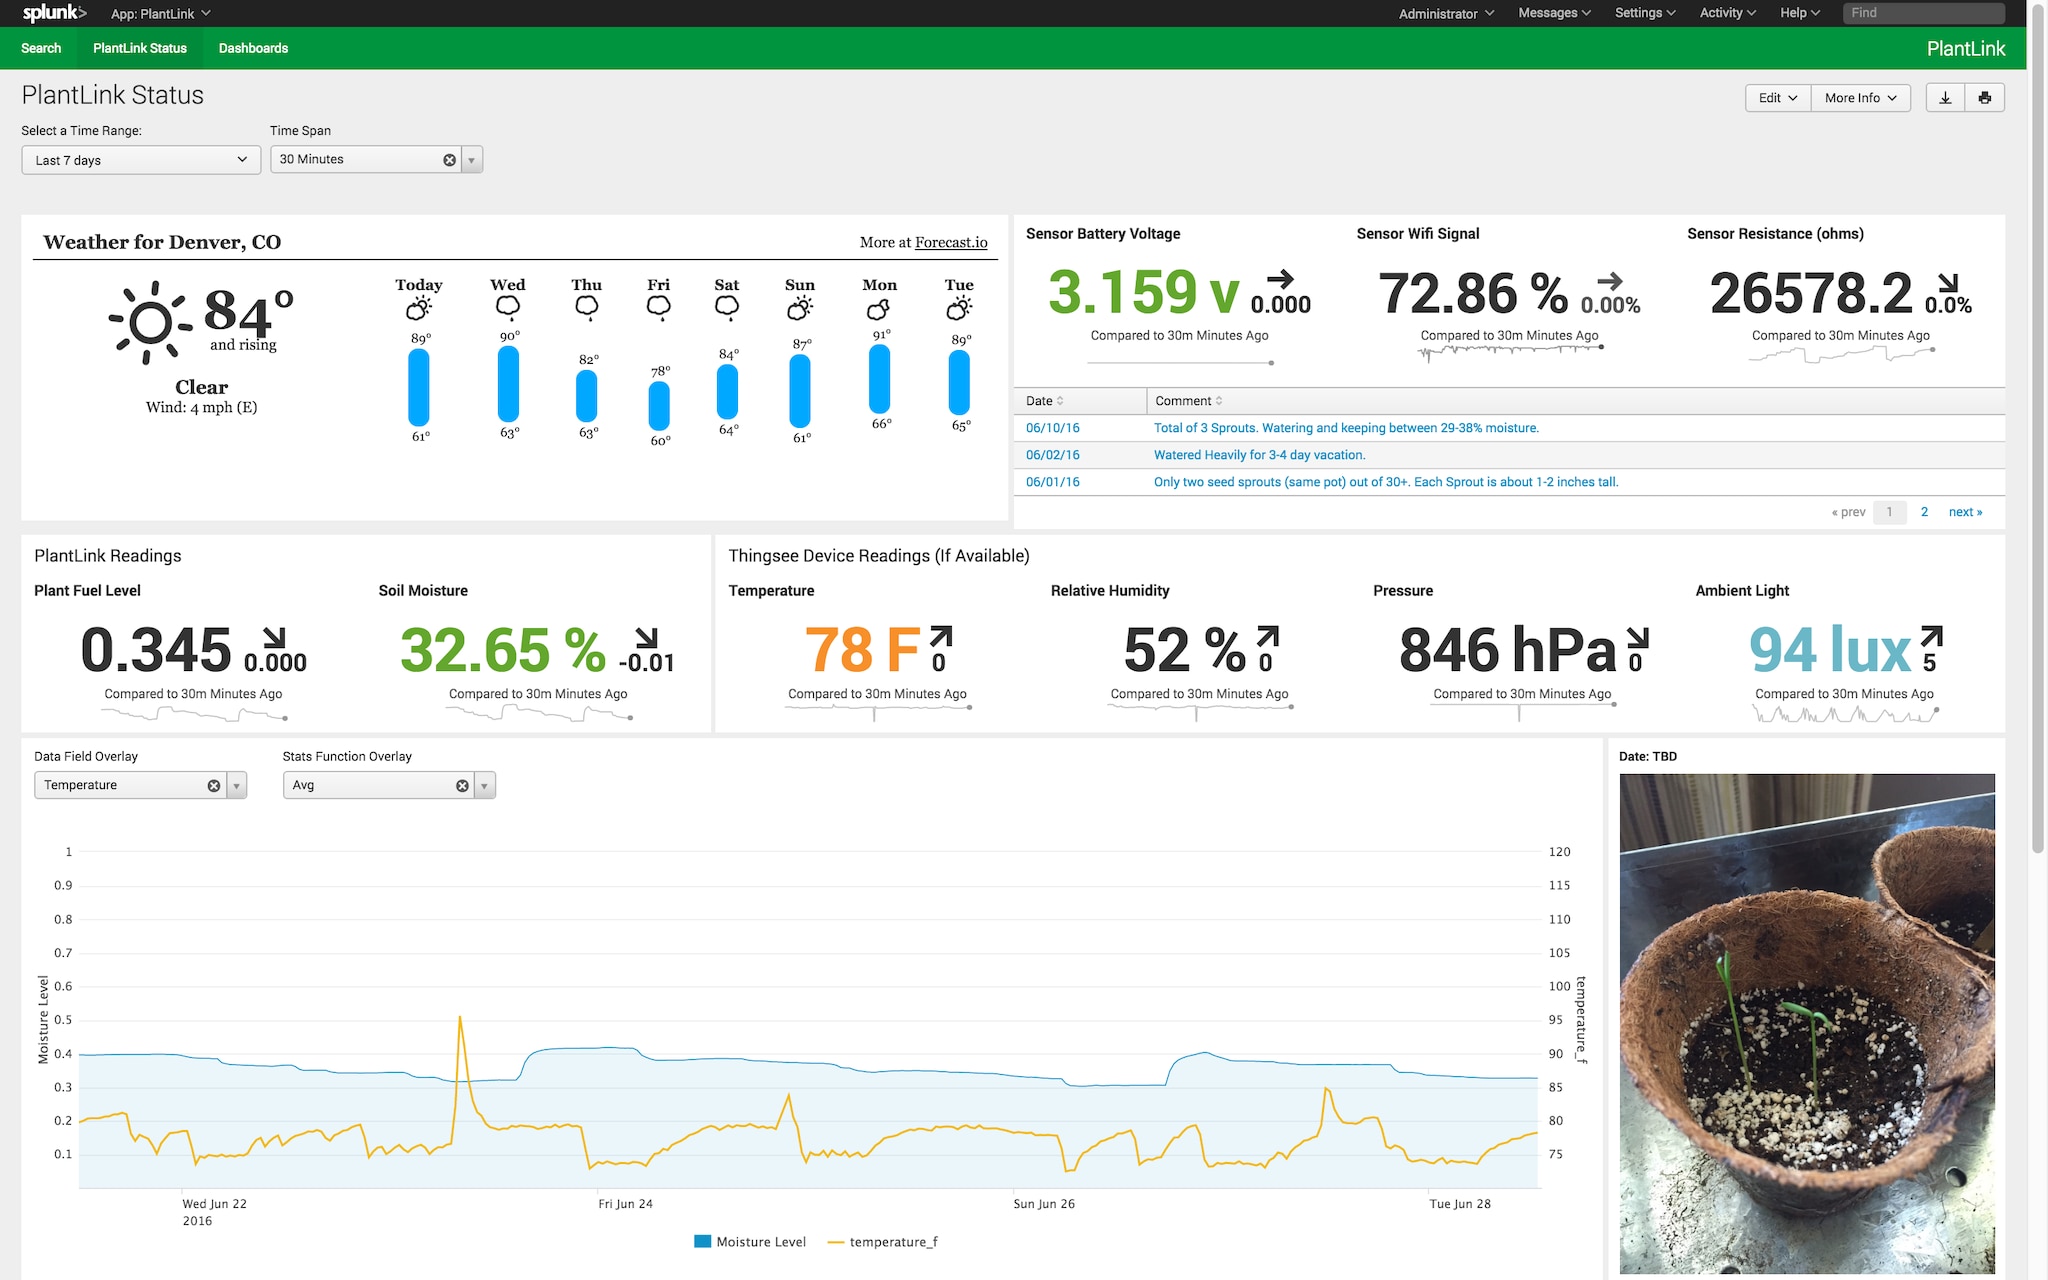
Now for my favorite part – building out a dashboard. I wanted a way to visualize all of these data sources in a ‘single pane of glass’ (there I said it..) so that I could measure the individual sources AND start looking for meaningful correlations in and across the data.
Additionally, I could monitor the health of the sensor itself (such as Battery level, and wifi signal strength) to make sure it is working properly. If I had a bunch of these sensors, I could use Splunk to look for deviations between them and possibly predict failures before they happen. Multiple use cases using the same data!
And VOILA!
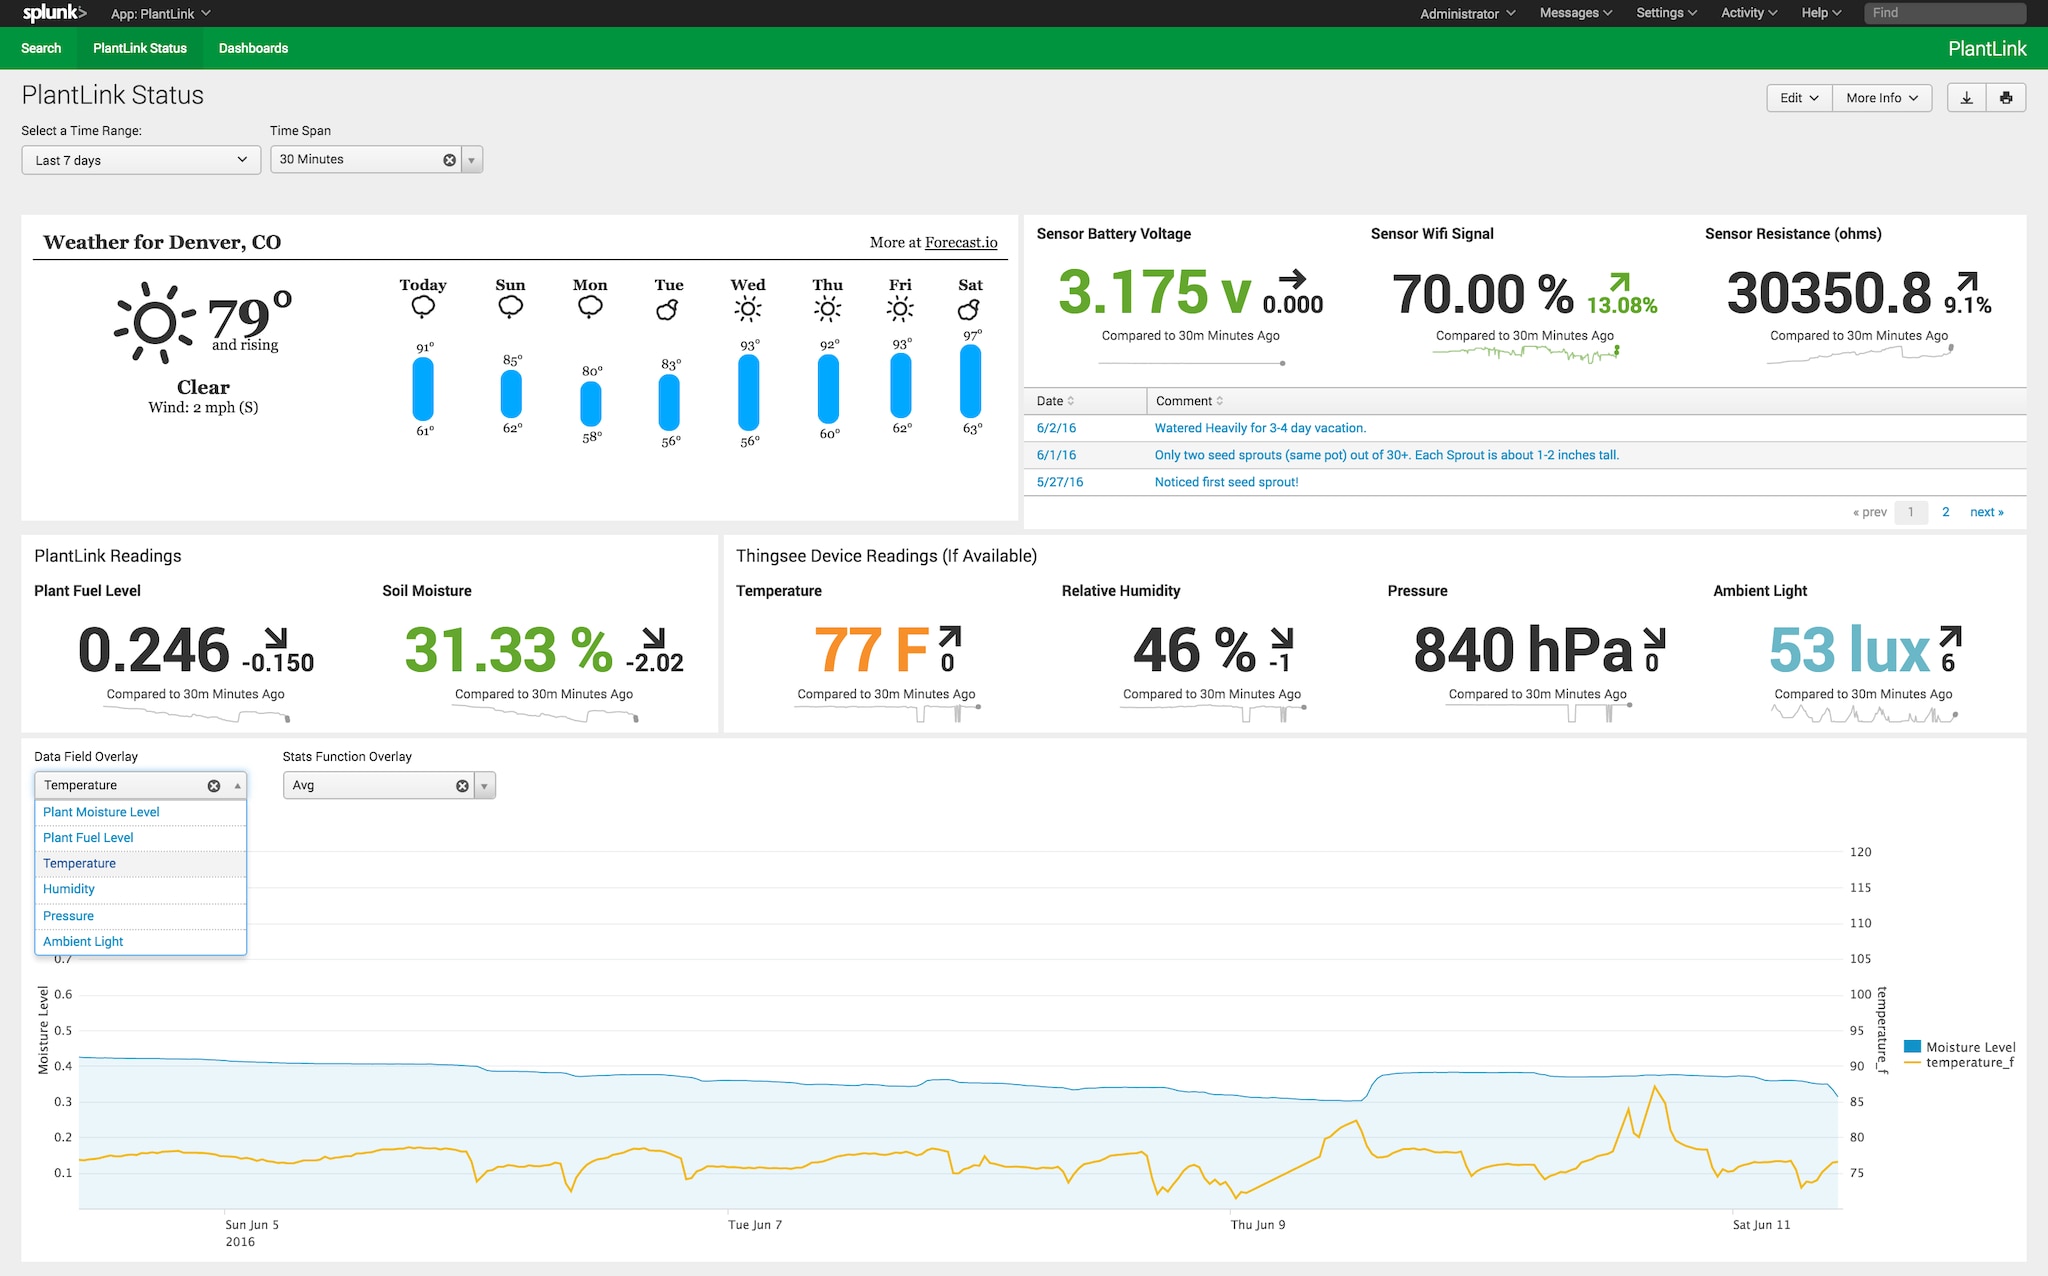
I also wanted to be able to view current and historical values from the PlantLink and Thingsee over any time range and granularity (from dropdowns at the top). To visualize correlations, I created a time-chart with the ability to choose an overlay field from any source. Lastly, I used the Lookup Editor App so I could enter my own comments in a table (top right) to keep track of progress. Know that I used no code or customizations to build this dashboard. So easy even a cave man, (err.. middle school student?) could do it!
Question everything!
Now, I can start asking ANY question of my data (more so than what each individual app can offer). What is the current moisture level and how fast is it dropping? Is the plant receiving enough or too much ambient light (using the lux sensor from the thingsee)? Does pressure, temperature or humidity (inside and outside??) have any effects on moisture movement? Who knows just yet, but as more data is collected, I can look for correlations and possible predictors that are meaningful in creating models with the free Machine Learning App for Splunk. Then, I can start configuring Splunk alerts to warn me of changes and predictions I care about. I sure do love having all of these capabilities in just one platform!
I’m just getting started with this project and some of the next steps will be:
Would love your ideas too – add comments!
Hope you enjoyed the post and as always Happy Splunking!
----------------------------------------------------
Thanks!
Stephen Luedtke

The Splunk platform removes the barriers between data and action, empowering observability, IT and security teams to ensure their organizations are secure, resilient and innovative.
Founded in 2003, Splunk is a global company — with over 7,500 employees, Splunkers have received over 1,020 patents to date and availability in 21 regions around the world — and offers an open, extensible data platform that supports shared data across any environment so that all teams in an organization can get end-to-end visibility, with context, for every interaction and business process. Build a strong data foundation with Splunk.

Get the latest articles from Splunk straight to your inbox.
© 2005 - 2024 Splunk Inc. All rights reserved.
