
Digital Resilience Pays Off
Download this e-book to learn about the role of Digital Resilience across enterprises.
Some of you may have attended the recent webinar on how to simplify ticket remediation with ML-Powered Analysis. We’re thrilled to announce that we have packaged the new app shown in that demo – the Smart Ticket Insights App for Splunk – and it is now live on Splunkbase!
This app is built on top of the Machine Learning Toolkit (MLTK) and provides a guided workflow to help gain insight into ticket data using machine learning. The Smart Ticket Insights app is the first in our new “Smart Workflows” domain-specific workflow series. Smart Workflows are machine learning (ML) applications built using the Splunk Machine Learning Toolkit (MLTK) that allow users to surface insights for common challenges unique to their vertical without needing to know how to build a model from scratch. The ecosystem includes the new Smart Ticket Insights app. A Smart Education Insights app will also be available for download from Splunkbase soon. Stay tuned for future updates!
As we discussed on the webinar, IT Operations teams often face a huge variety of support tickets related to all aspects of the business.
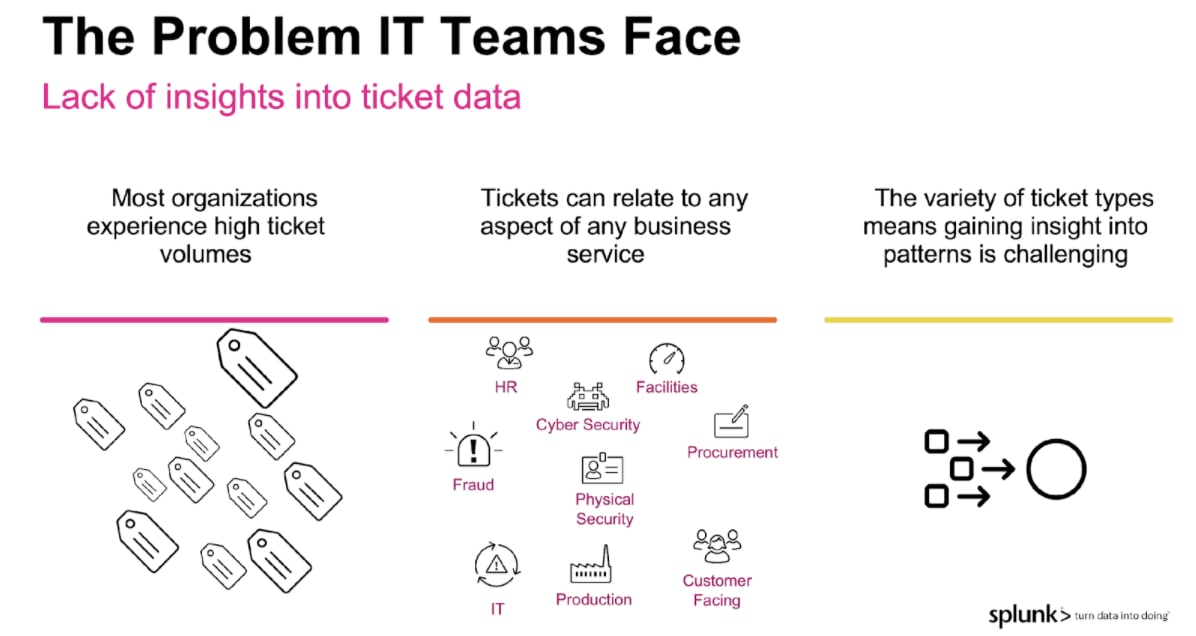
Being able to rapidly triage and respond to this variety of requests can be a big challenge, and the Smart Ticket Insights app for Splunk is designed to help identify patterns in ticket data so that operations teams can:
Once identified, tickets can be processed by further actions such as a playbook in Phantom to automate the remediation steps.
Once the app and its dependencies have been installed it’s as simple as inputting ticket data – such as ticket data collected from ServiceNow using the Splunk Add-on for ServiceNow or from Jira using the Add-on for JIRA – selecting the appropriate fields from the dropdowns, and pressing “go.”
The app itself consists of three sections which I will take you through and show you how to use each of them in this blog.
On this dashboard you first need to input a query that returns some ticket data. It is important that the data contains four fields: ID, category, subcategory and description. The ID should relate to the unique incident or ticket identifier. Once the query has run, you will be asked to select those four field types from a set of dropdowns.
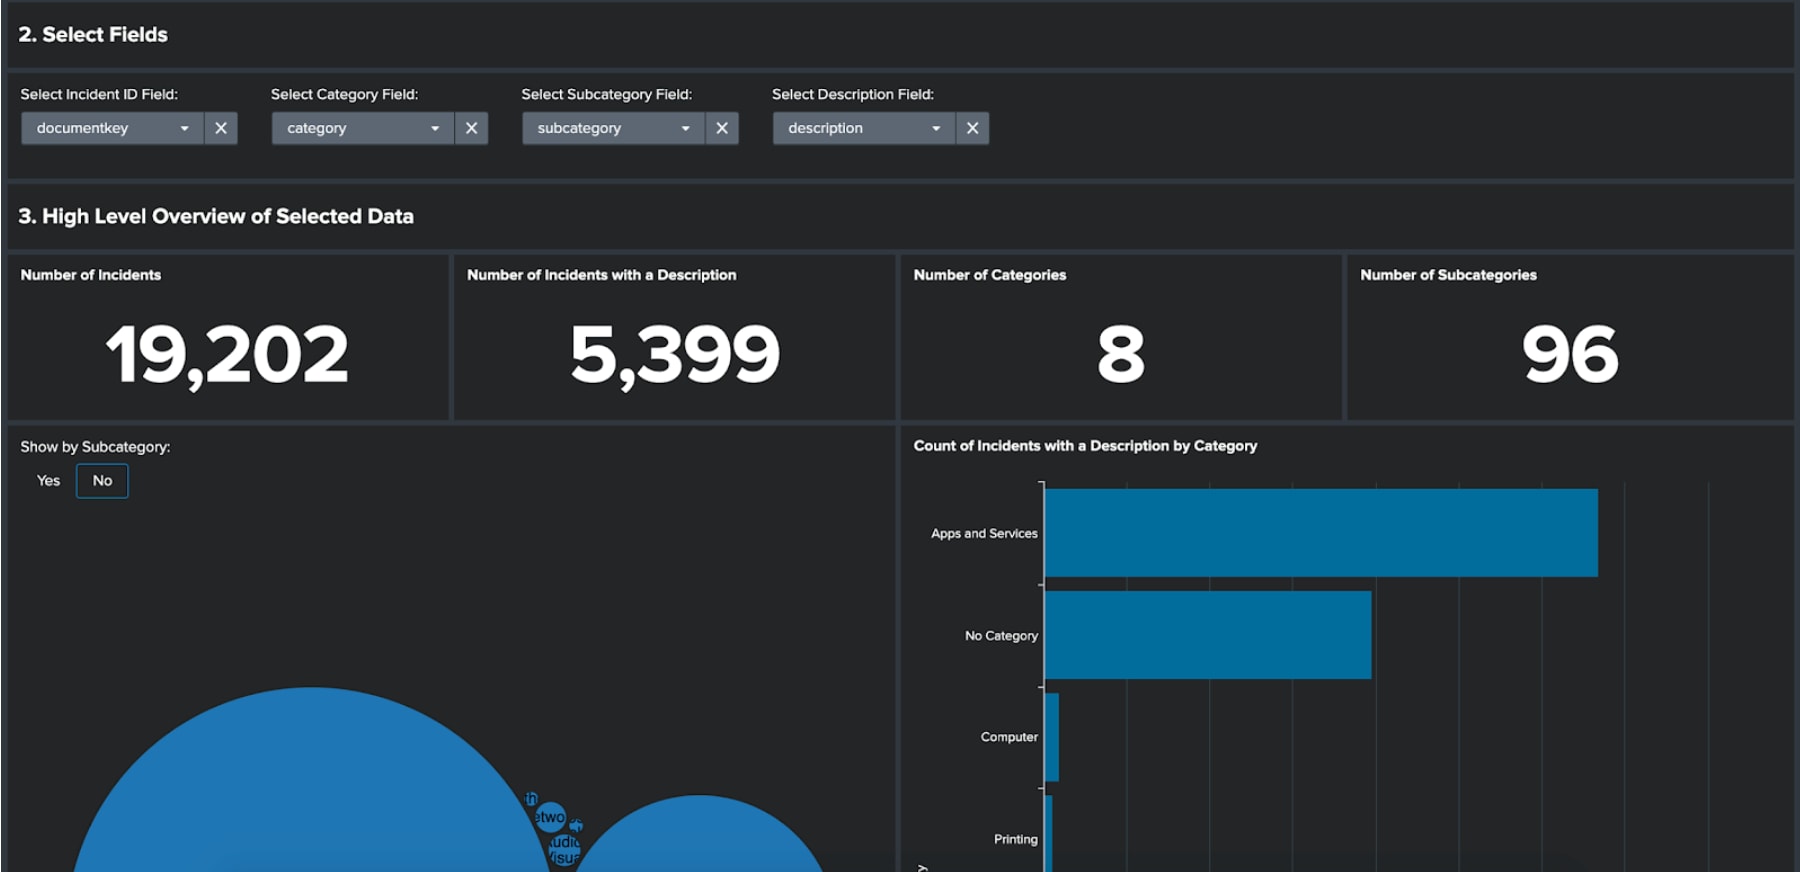
Once the fields have been selected a series of dashboard panels will provide high-level insight about your ticket data; such as the number of incidents and those incidents that include a description.
The key chart that gets presented is the ‘Count of Incidents with a Description by Category.’ This chart is important as it displays for each category how many incidents have a description. In the following sections of the app we will be analysing the descriptions for each category in turn to find insight about the tickets. This means that if there is a low number of descriptions for a given category, we will be unlikely to identify any insight.
Once you have studied this chart, select the cut-off point for mining category descriptions, input this into the dropdown below and then click the button to identify frequently occurring types of tickets to move to the next section.
This section of the app is designed to help train the models that are used to identify frequently occurring types of tickets. To train the models, all you need to do is select the category you want to analyse and confirm the model parameters: such as whether or not to include numeric values, how many terms need to be present in a cluster and the term sensitivity (35% meaning a term will be modelled only if it occurs in 35% or less of the descriptions).
Once you have made your selections the models will be trained. This consist of three main techniques:
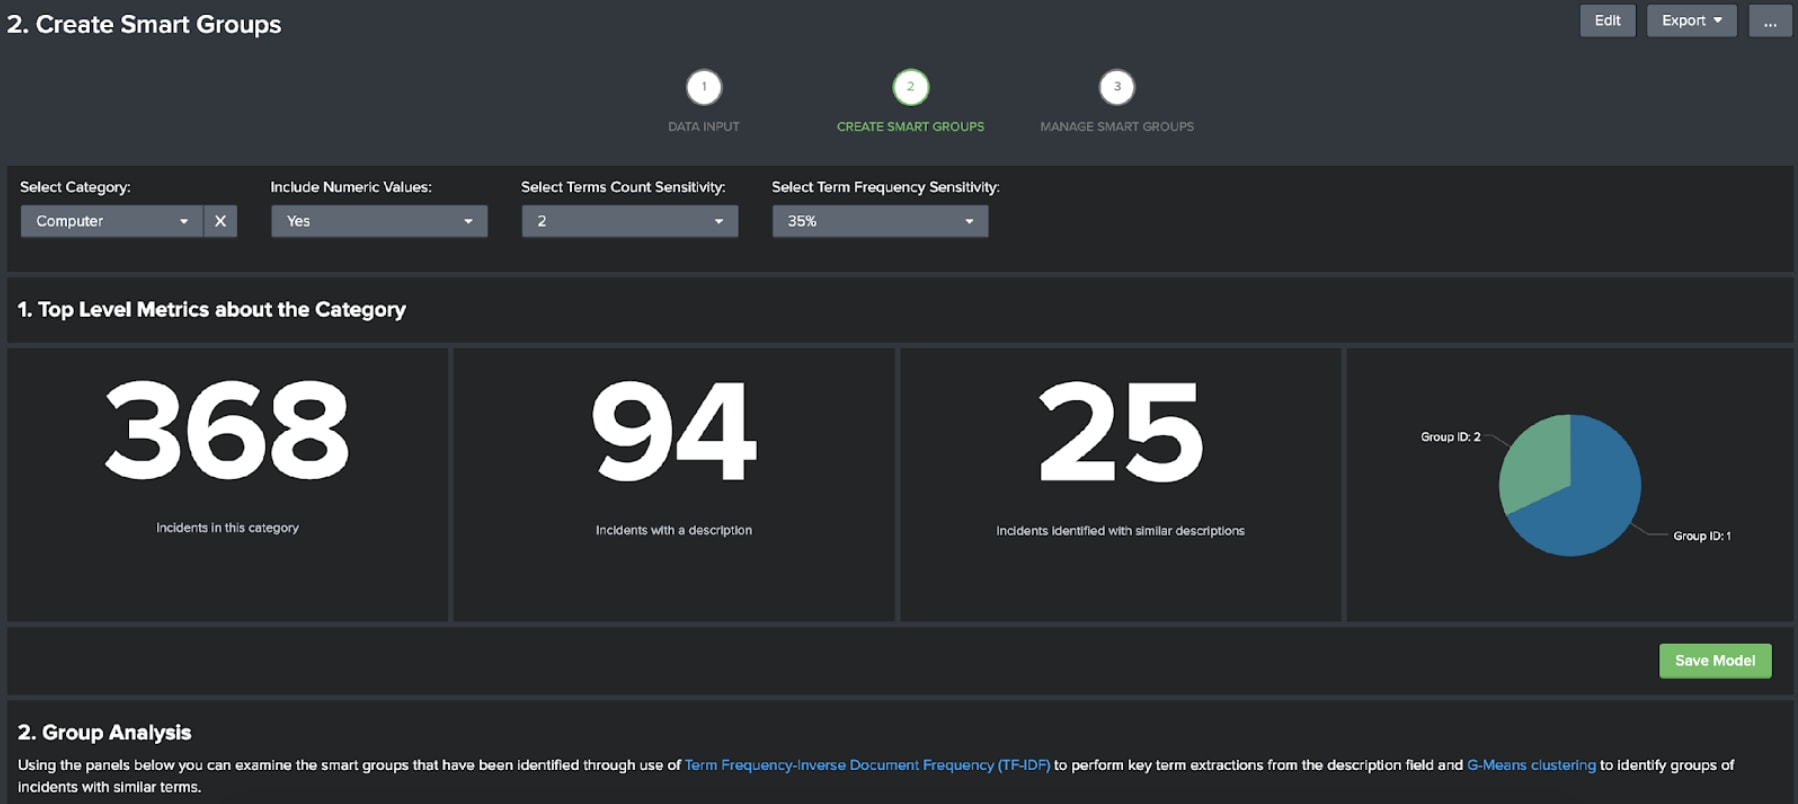
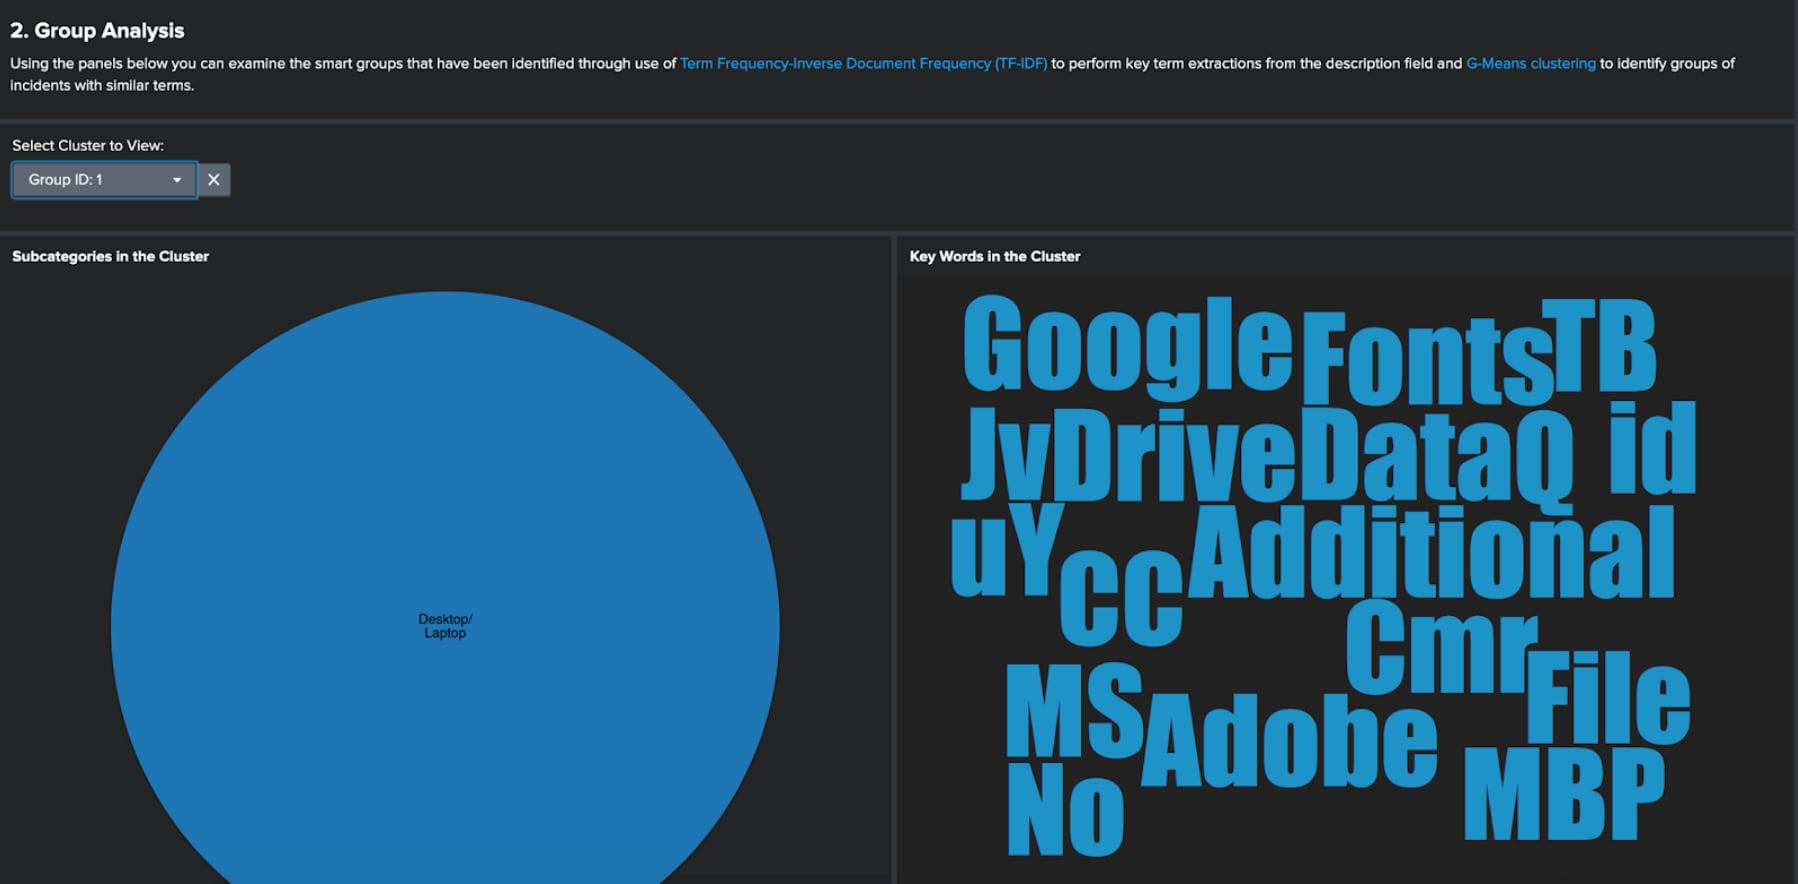
Once the models have been trained you can analyse the groups that have been identified, and provided you are satisfied that they are identifying similar types of tickets, you can save the models by clicking on the save model button.
Don’t worry if they aren’t perfect at this point – there are a few options for editing the groups in the next section of the app.
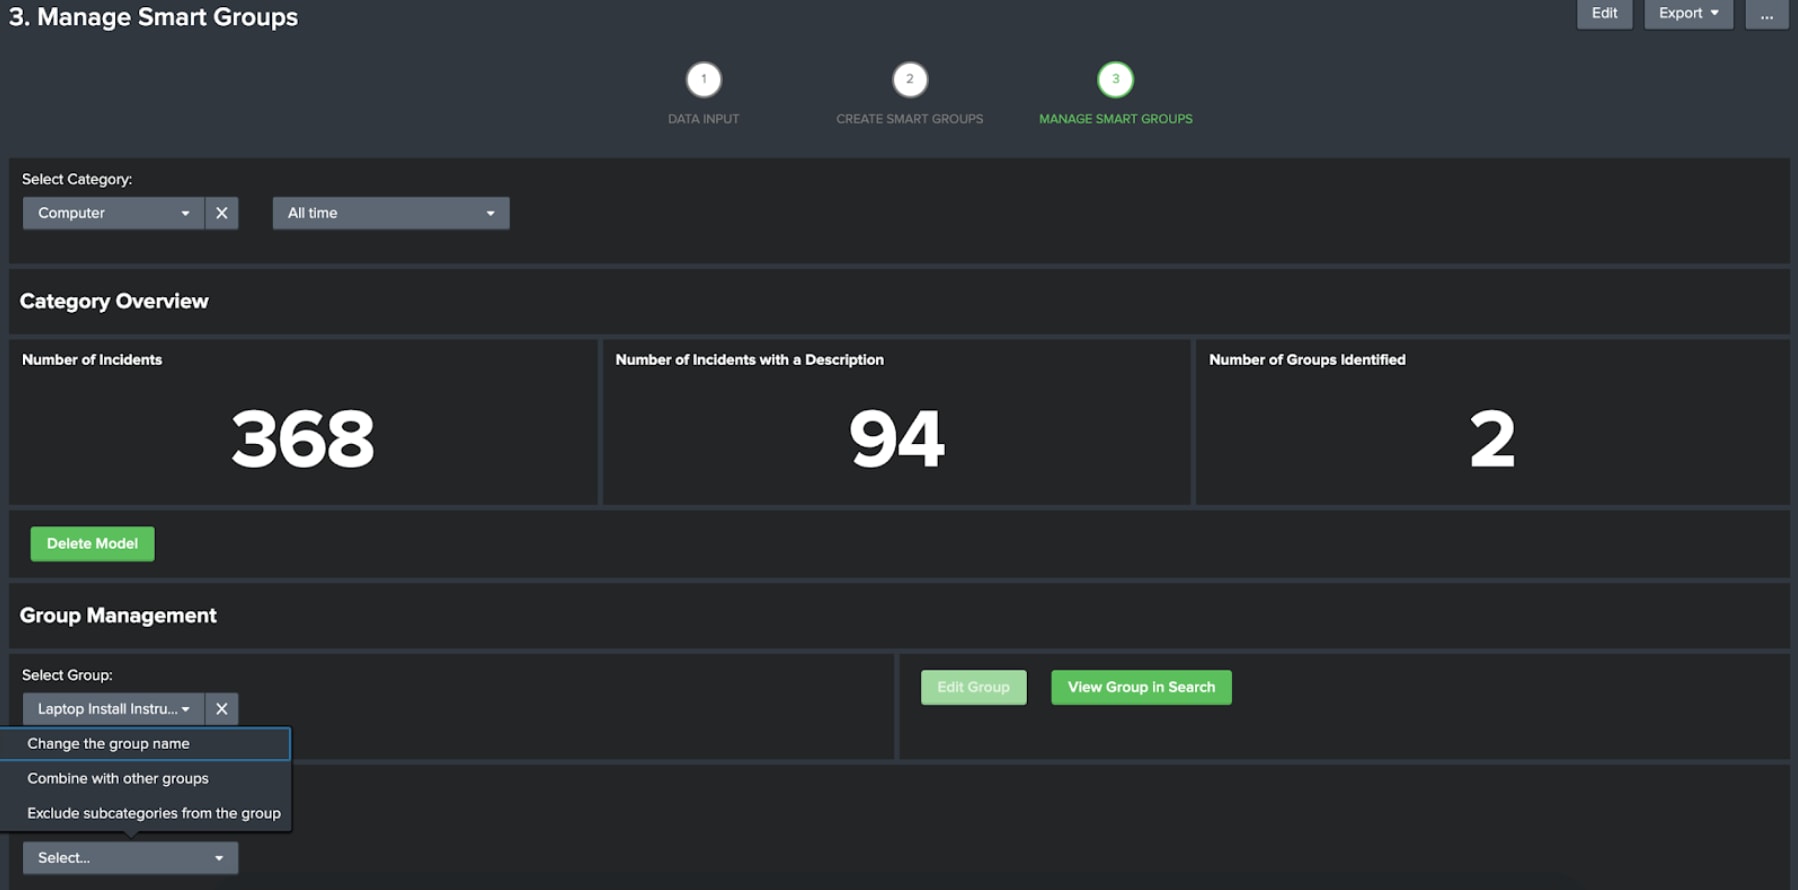
Once you have saved your models you can manage them from the manage smart groups dashboard.
On this dashboard you can select the category you want to manage. For each group you select you can edit the group and also open the group in search. There are three editing options:
You can also choose to delete the models if you wish.
The open in search button will provide you with a search to identify the group you have selected. This search can be set to run on a schedule and actions can be triggered if results are found – just like any other Spunk search. This means that if you come across this type of ticket you can trigger remediation actions from Splunk, such as running a Phantom playbook to gain the necessary HR and line management approvals to hire a new joiner.
This is the first in a series of Smart Workflow apps we are aiming to produce on top of the Machine Learning Toolkit to help users gain insight into their data using machine learning without needing to be a data scientist. Stay tuned for more by attending .conf20, visiting our website and checking out future blogs for further announcements about these verticalized Smart Workflows!

The Splunk platform removes the barriers between data and action, empowering observability, IT and security teams to ensure their organizations are secure, resilient and innovative.
Founded in 2003, Splunk is a global company — with over 7,500 employees, Splunkers have received over 1,020 patents to date and availability in 21 regions around the world — and offers an open, extensible data platform that supports shared data across any environment so that all teams in an organization can get end-to-end visibility, with context, for every interaction and business process. Build a strong data foundation with Splunk.

Get the latest articles from Splunk straight to your inbox.
© 2005 - 2024 Splunk Inc. All rights reserved.
