
Digital Resilience Pays Off
Download this e-book to learn about the role of Digital Resilience across enterprises.
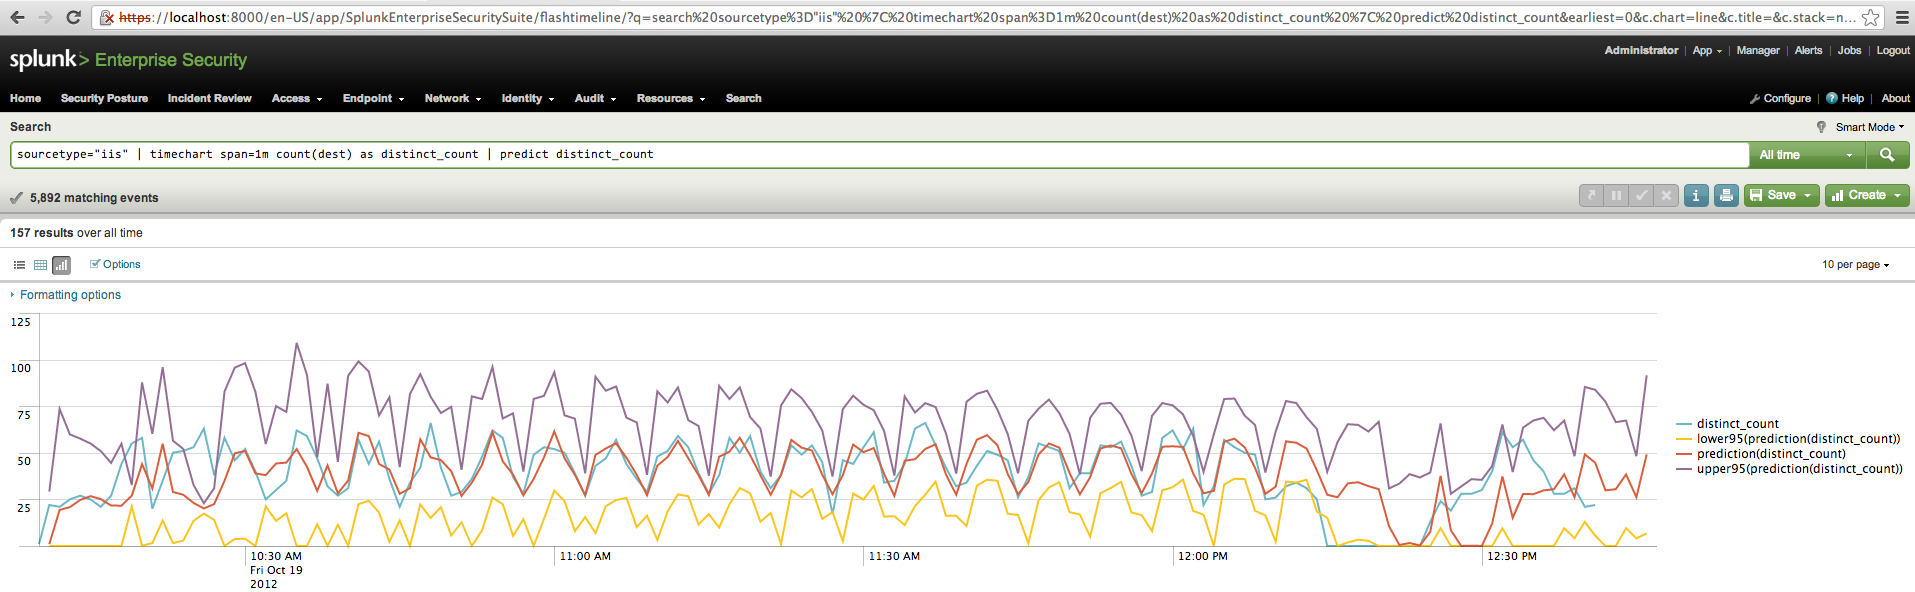
Splunk 5.0 brings some interesting new anomaly prediction commands to the table. While I haven’t had time to really drill into everything that’s available, I did enjoy playing with the new predict command (nota bene that it has an even smarter cousin, x11, which understands seasonal patterns). Give it an event stream and it will give you a “band of normalcy” tracking the 95th percentile ceiling and floor… along with predictions of what those values might expand to.
measured value, predicted value, upper and lower bounds for the band of normalcy
Of course, as soon as we have a band of normalcy we might start thinking about notifying people if there are any events where reality leaves that band…
sourcetype="iis" | timechart span=1m count(dest) as distinct_count | predict distinct_count | rename upper95(prediction(distinct_count)) as ceiling | rename lower95(prediction(distinct_count)) as floor | eval excession=if(distinct_count > ceiling, "100", "0") | eval recession=if(distinct_count < floor, "-100", "0") | table _time,excession,recession,distinct_count,ceiling,floor
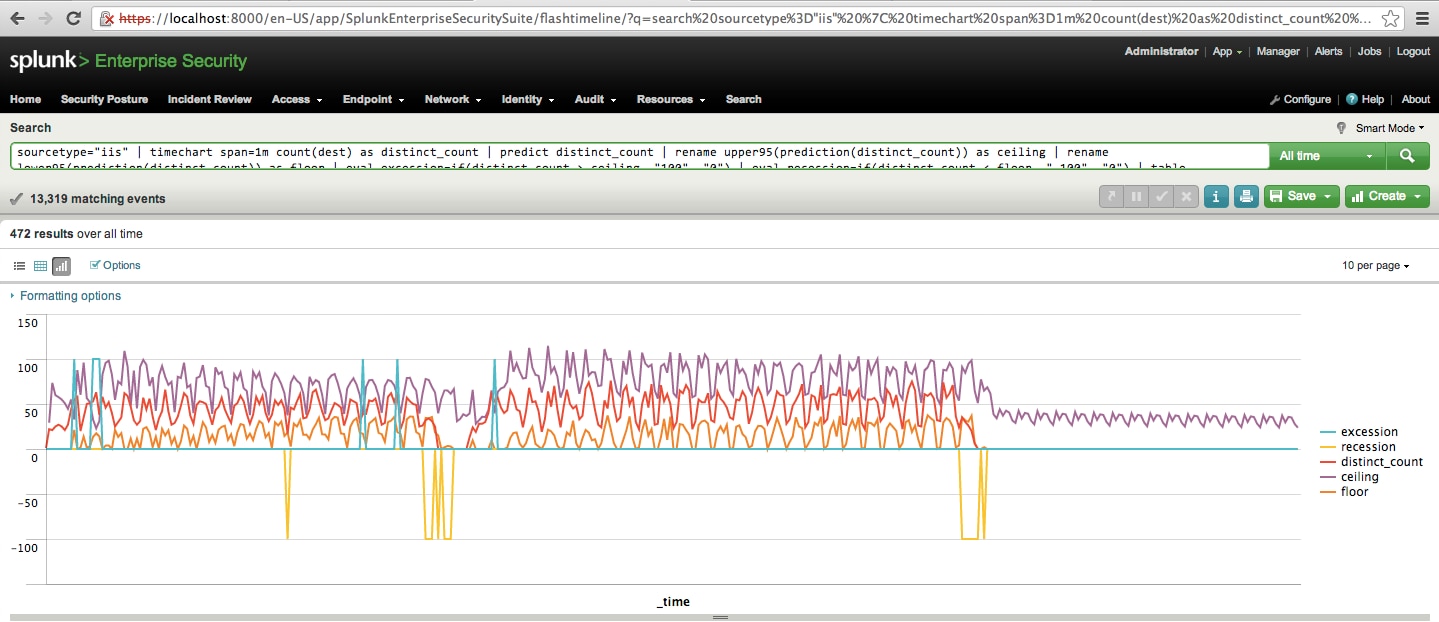
excessions and recessions from the predicted band of normalcy
Here we’re showing a graphic, suitable for monitoring; of course, we could also skip most of that and just alert whenever an excession or recession is detected, or even use those excession and recessions to correlate against something else before paging anybody at 3 in the morning. Simple anomaly detection and a prediction of reasonable future values without revisiting any textbooks, pretty nice!
----------------------------------------------------
Thanks!
Jack Coates

The Splunk platform removes the barriers between data and action, empowering observability, IT and security teams to ensure their organizations are secure, resilient and innovative.
Founded in 2003, Splunk is a global company — with over 7,500 employees, Splunkers have received over 1,020 patents to date and availability in 21 regions around the world — and offers an open, extensible data platform that supports shared data across any environment so that all teams in an organization can get end-to-end visibility, with context, for every interaction and business process. Build a strong data foundation with Splunk.

Get the latest articles from Splunk straight to your inbox.
© 2005 - 2024 Splunk Inc. All rights reserved.
