
Digital Resilience Pays Off
Download this e-book to learn about the role of Digital Resilience across enterprises.
Monitoring modern infrastructure poses fundamentally new challenges in terms of data volume and velocity. Collecting the metrics emitted by machines is only the first step. To extract value from that data, we need a method of expressing service, team, or business goals against that stream of data. That method is analytics.
This is the third in a series of post about how to use analytics to both compose the most salient signals to monitor out of raw metrics and also how to configure useful alerts.
In the first two posts, we discussed alert detectors built using threshold and duration conditions to trigger on persistently bad state and using transformations like rolling means and rolling maximums that capture behavior more subtle than simple persistent states. In this post we will discuss two common patterns that cause threshold-duration based alert detectors to exhibit the same kind of flappy behavior you might see when using static thresholds. We’ll see how to configure alerts in such a way that they are not flappy when these patterns occur.
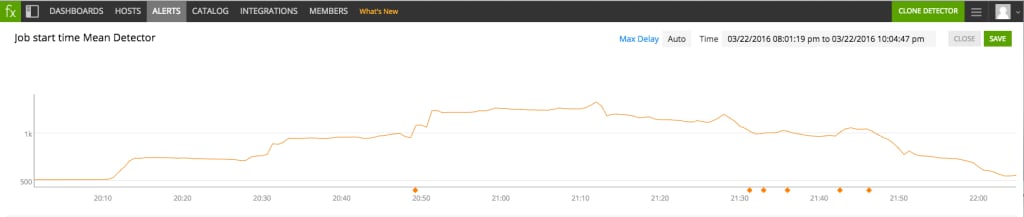
Let’s start with the pattern. The signal in this chart represents the maximum (taken over 15 machines) of the average time it takes for a job to start. The detector is set to fire when the signal is above 1000 (1 second) for one minute. Consider the following firing and clearing pattern on the signal (indicated by the orange diamonds on the horizontal axis):
Here the problem is that the signal very temporarily drops below the threshold of 1000 but then quickly returns to its elevated state. But there is something worth noting: the variation in this metric is normal and does not justify firing several alerts. This suggests using a distinct clearing condition for the detector, e.g. clear when the metric is below 900 for one minute.
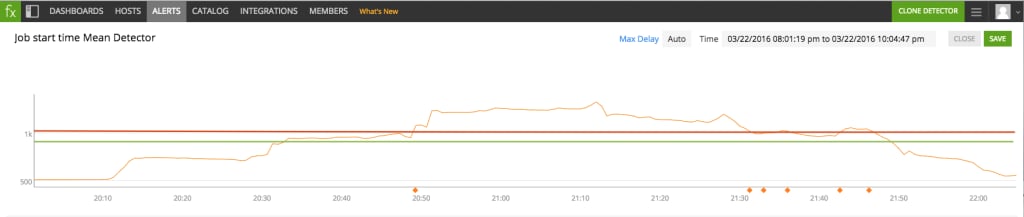
The metric being above 1000 for one minute is equivalent to its one-minute rolling minimum (RMin) being above 1000. The metric being below 900 for one minute is equivalent to its one-minute rolling maximum (RMax) being below 900. Thus the behavior we want is:
FIRE when RMin >= 1000; CLEAR when RMax < 900
Graphically, we want to fire when a minute is spent above the red line and clear once a minute is spent below the green line as shown here:
Note that the RMax is greater than or equal to the RMin. Therefore:
So we can re-characterize the desired behavior as:
FIRE when RMin >= 1000 AND RMax >= 900
CLEAR when RMax < 900 AND RMin < 1000
Now, suppose for the moment we have signals B and C with the following behavior:
By the implications above, B=1 implies C=1 and C=0 implies B=0. Therefore the sum B+C has three possible states:
The possible states of the signals B and C, and the desired behavior of the detector, are summarized in the following table.
B (RMin >= 1000) |
C (RMax >= 900) |
B+C |
Desired behavior |
1 |
1 |
2 |
Fire |
0 |
1 |
1 |
No change |
0 |
0 |
0 |
Clear |
“No change” means neither fire a new alert nor clear an existing one.
To B+C we apply an exclude rule to values within range [0.5, 1.5]. This modified form of B+C can only take on the values 0 and 2. Now we set the detector to fire when B+C is above 0. This only happens when the value is 2, namely when RMin >= 1000; and this only clears when the value is 0, namely when RMax < 900. The exclusion has the effect of ignoring the state B+C=1, which is precisely when the naive detector (above 1000 for one minute) would turn off and back on shortly thereafter in our initial example.
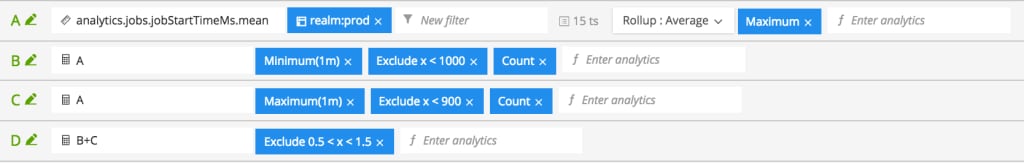
To construct the signal B, we first apply a one-minute rolling minimum transformation to the original signal. Then we exclude values less than 1000, so that we “publish” the rolling minimum when it is at least 1000 and we “publish” nothing when it is less than 1000. Finally we take the count, so we get 1 when there is a “published” time series and 0 if there is no such series. The resulting signal is exactly the desired signal B described above.
The signal C is constructed in a very similar way: we apply a one-minute rolling maximum, exclude values less than 900, and then take the count.
The necessary analytics are shown below in SignalFx. Line A contains the original metric (the summary of the job start time across a cluster), and line D corresponds to the signal on which we should alert.
Although reasoning through and configuring well constructed alert detectors like this can be complicated, SignalFx provides starting points with templates for detectors that are surfaced in context and totally customizable.

The Splunk platform removes the barriers between data and action, empowering observability, IT and security teams to ensure their organizations are secure, resilient and innovative.
Founded in 2003, Splunk is a global company — with over 7,500 employees, Splunkers have received over 1,020 patents to date and availability in 21 regions around the world — and offers an open, extensible data platform that supports shared data across any environment so that all teams in an organization can get end-to-end visibility, with context, for every interaction and business process. Build a strong data foundation with Splunk.

Get the latest articles from Splunk straight to your inbox.
© 2005 - 2024 Splunk Inc. All rights reserved.
