
Digital Resilience Pays Off
Download this e-book to learn about the role of Digital Resilience across enterprises.
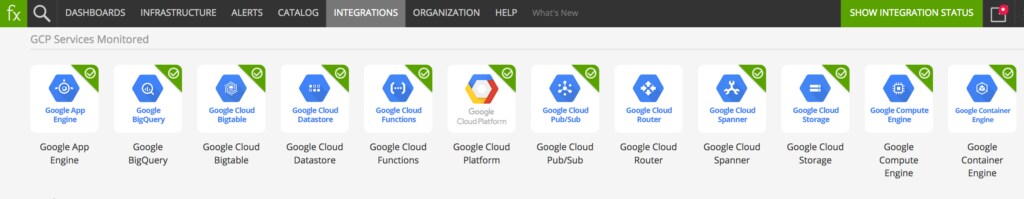
Google Cloud Platform is rapidly becoming an integral part of the evolving cloud landscape. GCP is continually adding new services and enhancing existing ones, establishing leadership in areas such as machine learning, and attracting both businesses making their first move to the cloud as well as those pursuing a multi-cloud strategy.
At SignalFx we are excited about our new integration with Google Cloud Platform enabling flexible visualization, real-time streaming analytics, correlation, and smart alerting on a massive scale from GCP service metrics.
Following the simple steps to connect to Google Cloud Platform, Stackdriver GCP metrics will be synced into SignalFx. Built-in content ensures that you get visibility and insights as soon as the metrics start streaming in.
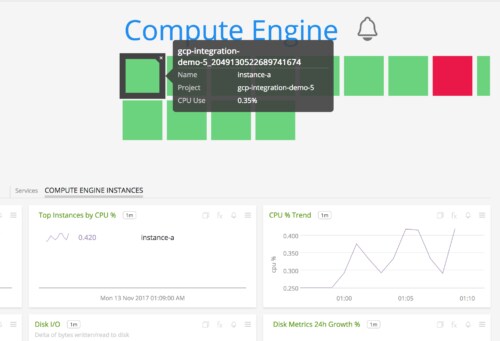
The SignalFx Infrastructure Navigator provides a data-driven visualization of the resources in your GCP environment. Each resource instance is represented by a square that is colored according to the value of a chosen metric. In the example below color corresponds to CPU Utilization
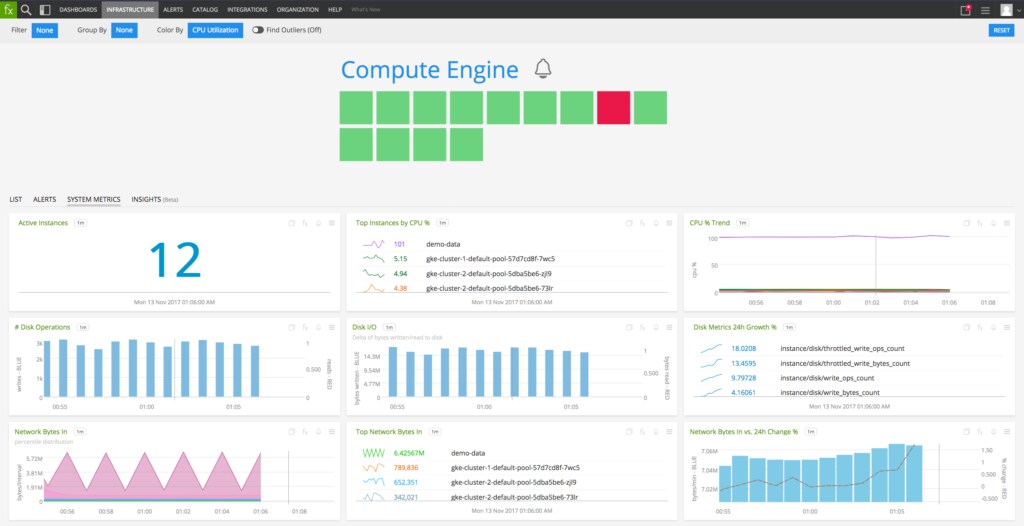
This gives you an immediate overview of the health of your system and allows you to drill down to content and views for specific instances.
We provide a rich set of dashboards that are custom built for Google Compute Engine, Google Container Engine, Google Cloud Functions, Google BigQuery, and many more GCP services. Built-in dashboards are designed for monitoring both metrics aggregated across resource instances, as well as drilling down to metrics from single instances. You can of course customize the charts and dashboards based on your preferences and specific needs.
An example is this built-in dashboard for a single Google Compute Engine instance.
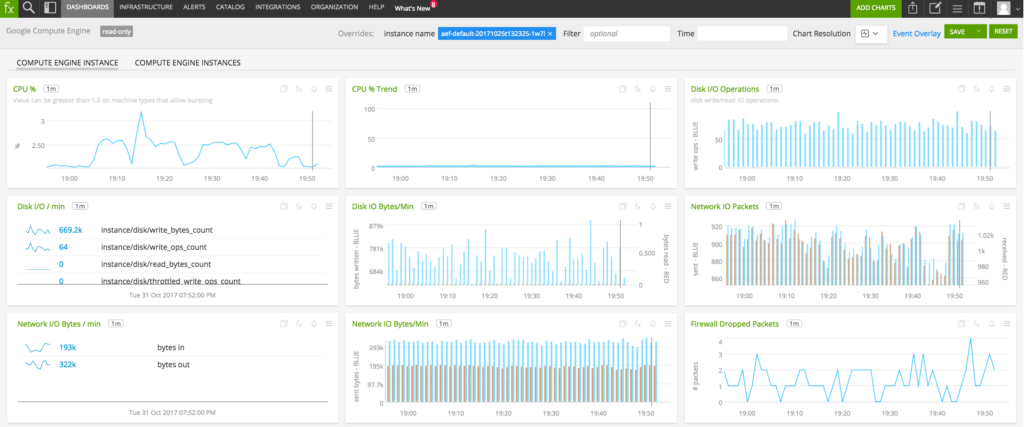
SignalFx supports arbitrary dimensions and flexible metadata. GCP metrics in SignalFx contain dimensions that correspond to labels from Stackdriver metrics (e.g. source as a label on >system/cpu/usage metric from Google App Engine) and as always, you can slice and dice by these dimensions. Importing project level (e.g. gcp_project_name) and service specific (e.g. gcp_machine_type) metadata from GCP, and making it available as properties, allows you to filter metrics by their metadata in charts and detectors.
Besides leveraging Google Stackdriver metrics, you can additionally monitor Compute Engine instances and the services running on them by using the SignalFx collectd agent. This allows you to see metrics at a finer per-second resolution and offers a higher degree of customization than is possible with Stackdriver alone. Note that some GCP services do not provide the ability to install an agent.
The SignalFlow real-time streaming analytics engine makes it easy to accomplish a range of tasks in charts and detectors — from combining multiple individual metrics into compound metrics, to using functions such as Timeshift (offsetting metrics by a day, week, month, etc), Percentile (e.g. p90 from a population of instances), and exponentially weighted moving average. All of this can be done in the UI or thru our API.
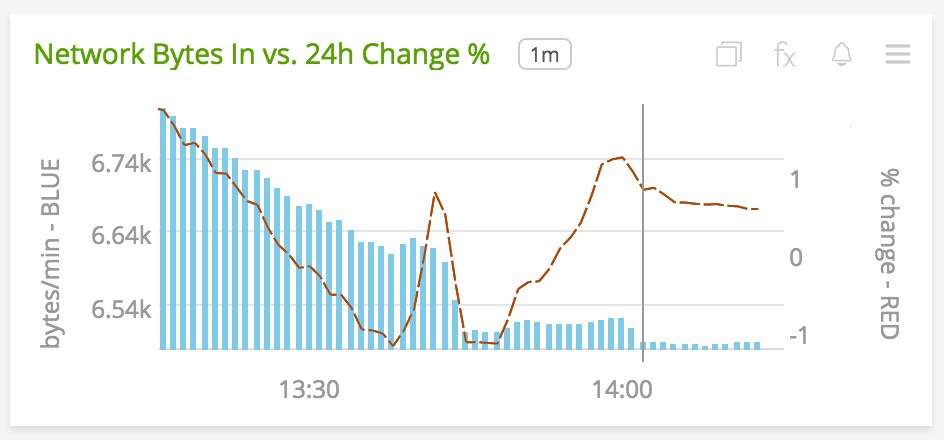
Below is a chart that shows Network Bytes In (blue bars) with the percentage of change compared to 24 hours ago (red line), for a Google Compute instance. The 24h change line is created by taking the instance/network/received_bytes_count time series, timeshifting it by a day, and comparing the two using the SignalFx Plot Editor UI.
For alerting you can again choose from a range of built-in conditions.
To build on the previous example, you can easily activate a detector that notifies you when the Network Bytes In signal is different from the same periods in the past (quite useful when for cyclical data).
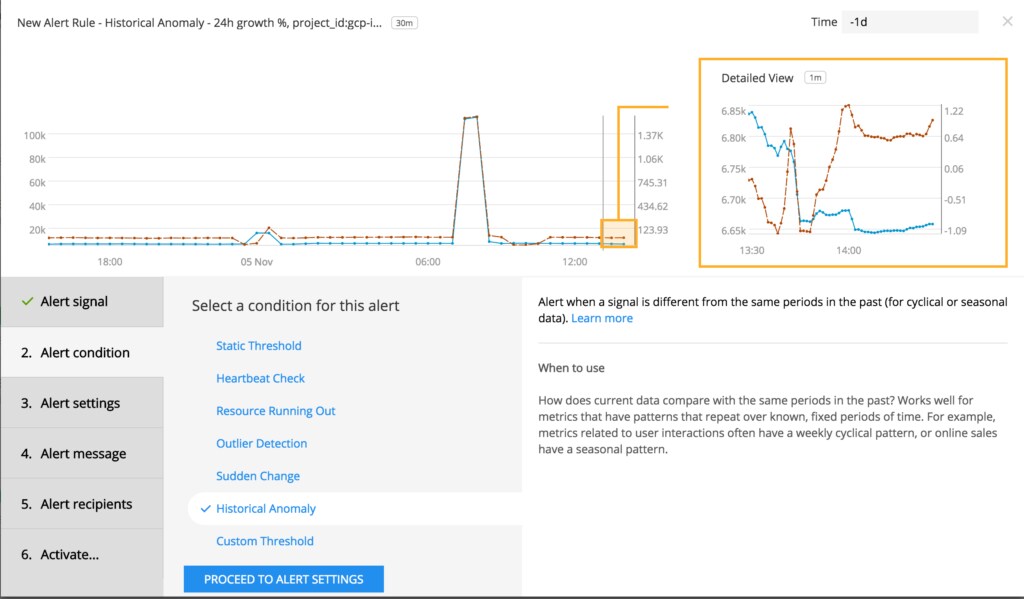
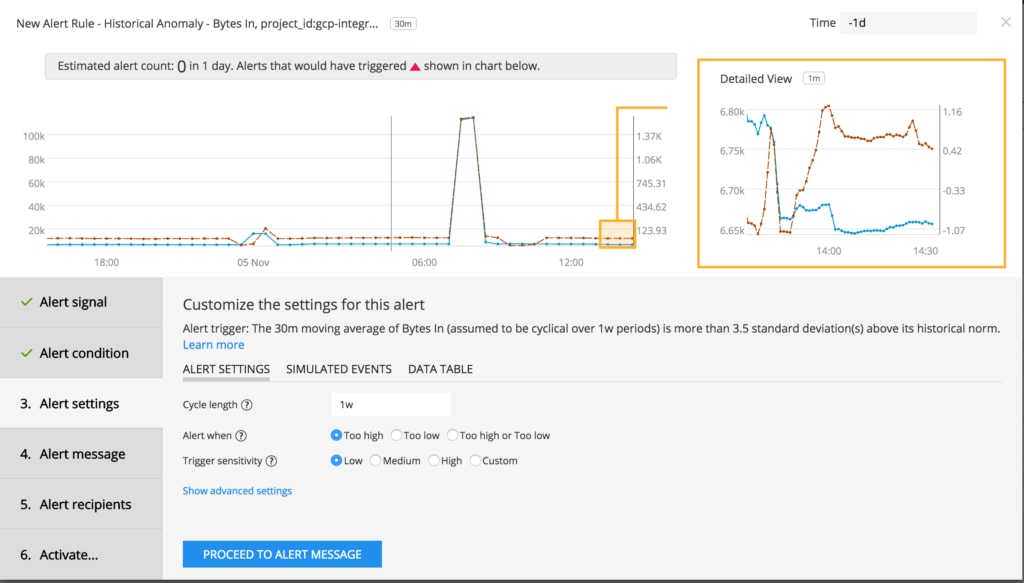
In addition to the Historical Anomaly example above, you have a range of built-in alert conditions to choose from including simply checking a static threshold, to letting SignalFx Analytics find outliers, flag sudden change, or predict that a resource is going to run out soon.
The GCP integration represents yet another important step in our continuing work of making it easier for everyone to turn on powerful operational intelligence across all of their platforms.
The best way to see the SignalFx and GCP integration is to try it yourself or request a demo. As always we love to hear your thoughts, so please share them by reaching out to us here.
Thanks,
Suhail Rashid

The Splunk platform removes the barriers between data and action, empowering observability, IT and security teams to ensure their organizations are secure, resilient and innovative.
Founded in 2003, Splunk is a global company — with over 7,500 employees, Splunkers have received over 1,020 patents to date and availability in 21 regions around the world — and offers an open, extensible data platform that supports shared data across any environment so that all teams in an organization can get end-to-end visibility, with context, for every interaction and business process. Build a strong data foundation with Splunk.

Get the latest articles from Splunk straight to your inbox.
© 2005 - 2024 Splunk Inc. All rights reserved.
