
How to Create Custom Dashboards and Alerts to Achieve the Best Mean Time to Detection
Alerts and dashboards are essential to observability. They allow you to catch problems anywhere in your environment so you can rapidly identify their causes and minimize service degradation and disruption. Splunk Observability Cloud uses detectors, events, alerts, and notifications to keep you informed when certain criteria are met.
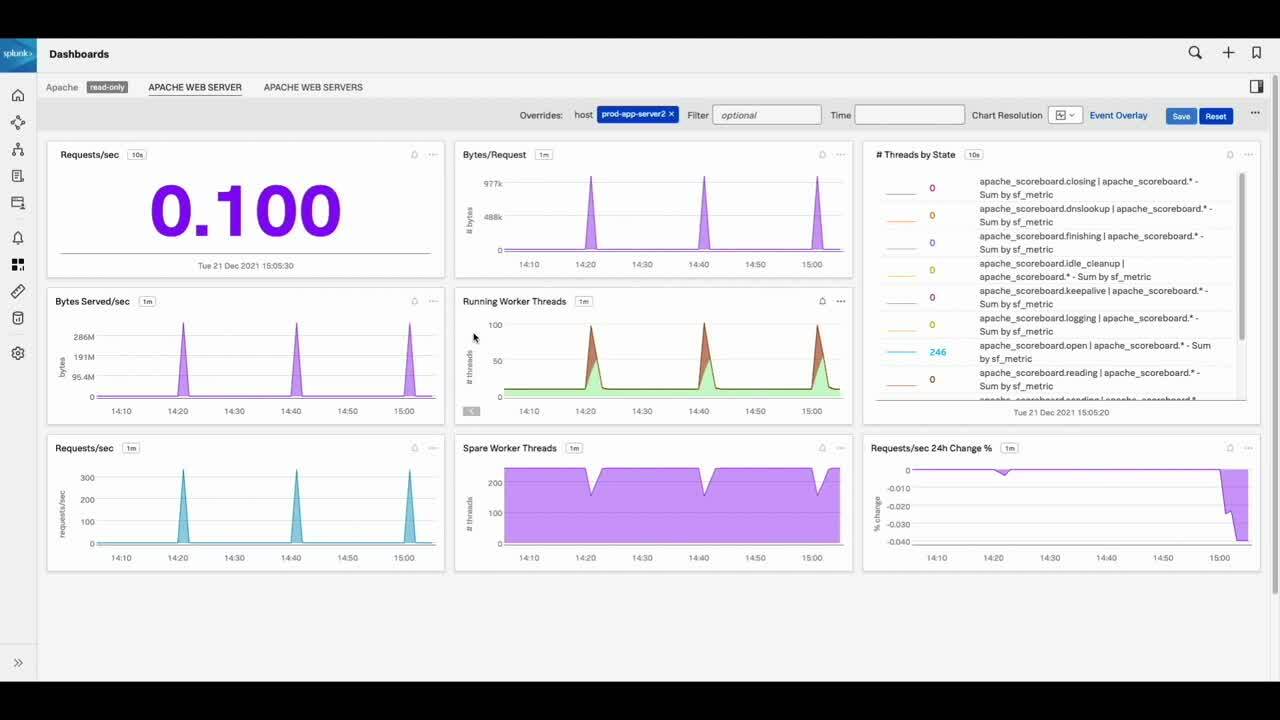
In this Splunk Tech Talk, DevOps Edition, we will cover just how to create custom dashboards and alerts to achieve the best Mean Time to Detection for possible issues and mitigate service degradation.
In this video you'll learn:
How you can create and customize new and existing dashboards
Share dashboards with teammates
Set dashboard permissions with teammates
How to configure alerts based on your data for the best Mean Time to Detection (MTTD)
Related Videos

Intro to Real User Monitoring in Splunk Observability Cloud

The Future of Observability With Splunk Powered by Agentic AI
