
Digital Resilience Pays Off
Download this e-book to learn about the role of Digital Resilience across enterprises.
Plotting two time-series in a single chart is a question often asked by many of our customers and Answers users. Admittedly, given the many ways to manipulate data, there are several methods to achieve this [1]. Most of them frequently use two searches – a main search and a subsearch with append – to pull target data over the adjacent timeranges that we’re interested on. Then, the _time field is manipulated to overlay both time graphs. While there is nothing wrong with this method, it is typically more efficient to use a single search instead.
I have created and I am sharing three macros to facilitate this. They paint two time-series graphs by using one search while manipulating the _time field and then keying the series off of a new marker field.
What do the macros do?
Well, all of them operate on two parameters, a search and a measure, and accomplish the same thing but over three different time ranges.
eval marker = if(_time < info_min_time + 3600, "Last Hour", "Current Hour") create a marker field keyed-off of info_min_time of the search – this will enable us to temporally mark (or label) each of the series.eval _time = if(_time < info_min_time + 3600, _time + 3600, _time) rewrite (or rather, shift) _time values based on the distance from info_min_time of the search – this will accomplish overlaying of the series on the same time frame.Feel free to modify the configurations below as necessary but whatever clever changes and improvements you make (such as adding more series or parametrizing even further ex. the time range, the span etc.), please share with the Community.
#macros.conf
#-----------

# hour over hour, 1m span
[twoseries_h(2)]
args = search, measure
definition = $search$ earliest=-1h@h \
| bin span=1m _time\
| addinfo\
| eval marker = if(_time < info_min_time + 3600, "Last Hour", "Current Hour") \
| eval _time = if(_time < info_min_time + 3600, _time + 3600, _time) \
| chart $measure$ by _time marker
iseval = 0

# day over day, 15m span
[twoseries_d(2)]
args = search, measure
definition = $search$ earliest=-1d@d \
| bin span=15m _time\
| addinfo\
| eval marker = if(_time < info_min_time + 24*3600, "Yesterday", "Today") \
| eval _time = if(_time < info_min_time + 24*3600, _time + 24*3600, _time) \
| chart $measure$ by _time marker
iseval = 0

# week over week, 1h span
[twoseries_w(2)]
args = search, measure
definition = $search$ earliest=-1w@w\
| bin span=1h _time\
| addinfo\
| eval marker = if(_time < info_min_time + 7*24*3600, "Last Week", "Current Week") \
| eval _time = if(_time < info_min_time + 7*24*3600, _time + 7*24*3600, _time) \
| chart $measure$ by _time marker
iseval = 0
Sample Searches:
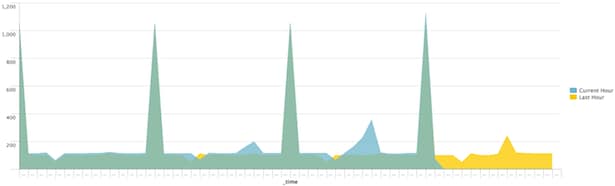
Event Count: Current Hour vs. Last Hour
`twoseries_h("index=_internal", count)`
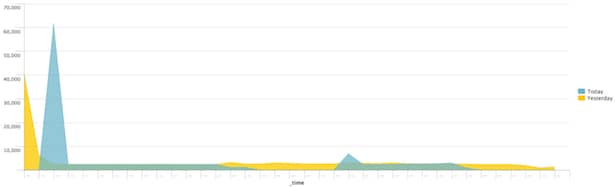
Event Count: Today vs. Yesterday
`twoseries_d("index=_internal", count)`
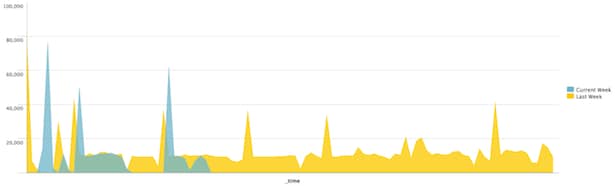
Event Count: Current Week vs. Last Week
`twoseries_w("index=_internal", count)`
[1]
Compare Two Time Ranges in one Report
2 Searches, 1 chart
2 Searches, 1 graph
Line chart comparing yesterday’s result with today’s result in dashboard
----------------------------------------------------
Thanks!
Dritan Bitincka

The Splunk platform removes the barriers between data and action, empowering observability, IT and security teams to ensure their organizations are secure, resilient and innovative.
Founded in 2003, Splunk is a global company — with over 7,500 employees, Splunkers have received over 1,020 patents to date and availability in 21 regions around the world — and offers an open, extensible data platform that supports shared data across any environment so that all teams in an organization can get end-to-end visibility, with context, for every interaction and business process. Build a strong data foundation with Splunk.

Get the latest articles from Splunk straight to your inbox.
© 2005 - 2024 Splunk Inc. All rights reserved.
