
Digital Resilience Pays Off
Download this e-book to learn about the role of Digital Resilience across enterprises.
It’s only taken me two years, but I’ve finally answered a question that I was asked by Derek King – “Can we use ML to detect botnets?” Thanks Derek, that was a pretty heavy question to be asked in your first week at Splunk, especially when you have no Splunk experience…
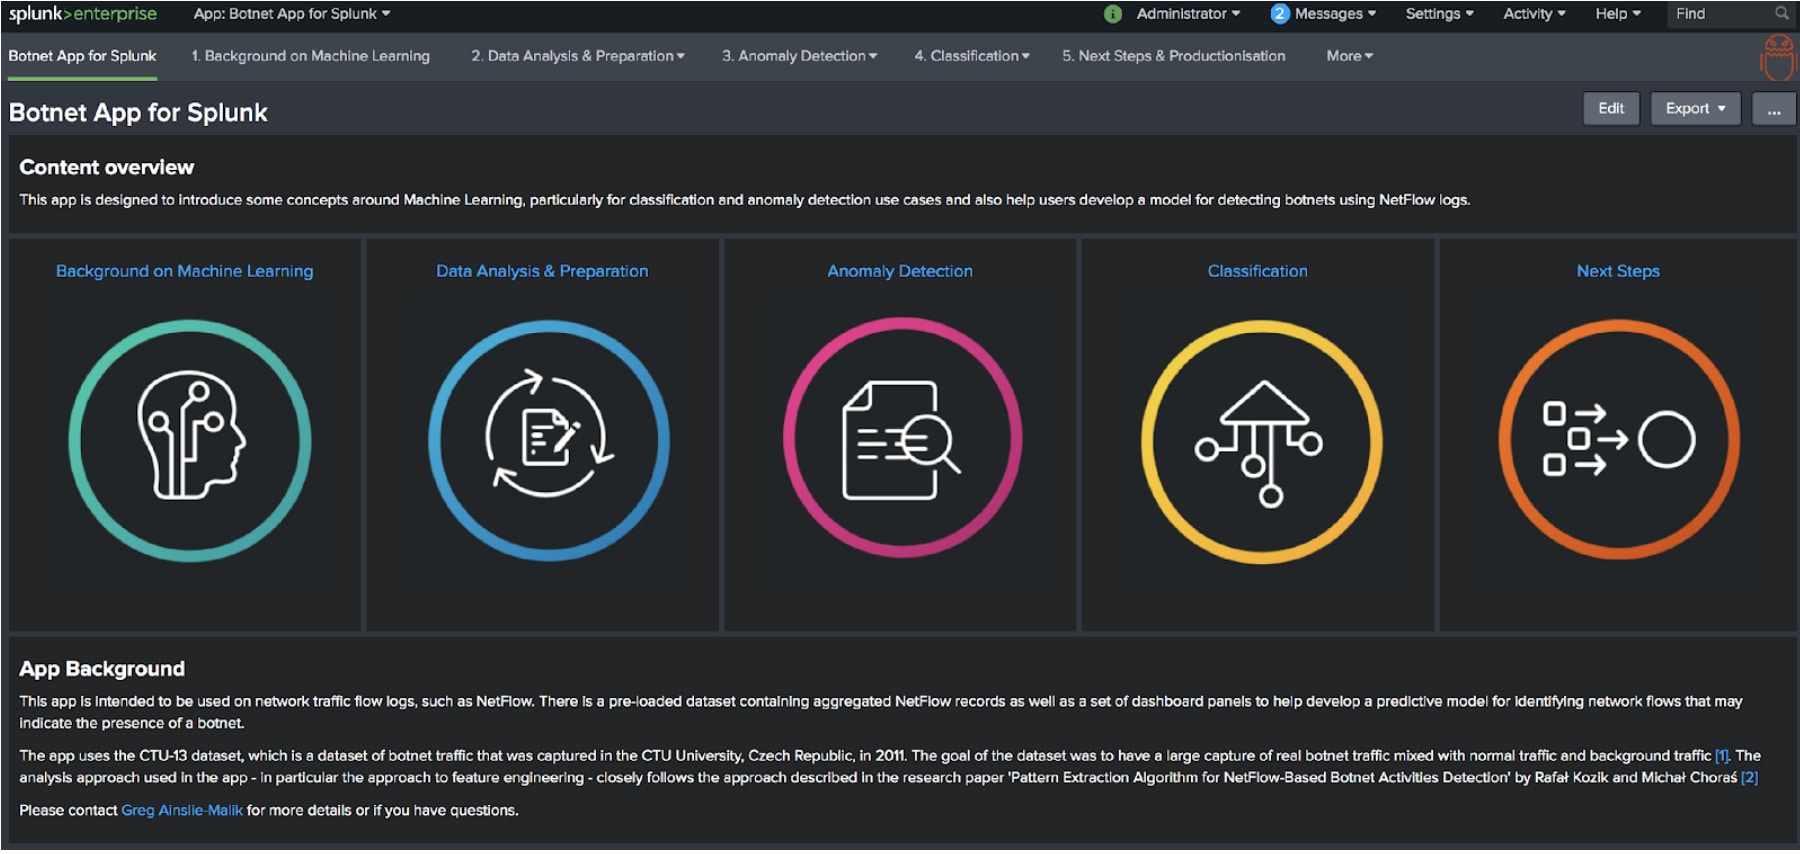
You can judge the results here using the Botnet App for Splunk.
It’s not quite the BotSniffer or BotMiner technique that Derek requested – you’ll have to wait another two years for that the way I’m going so far – but if you read the research paper 'Pattern Extraction Algorithm for NetFlow-Based Botnet Activities Detection' by Rafał Kozik and Michał Choraś you could come to the conclusion there are better methods out there. And to be honest I’ve pretty much followed their approach to detecting botnets on the CTU-13 dataset in the app.
For those of you less familiar with Machine Learning techniques and concepts the app should help you learn a little bit about Machine Learning as well!
The CTU-13 dataset contains roughly 20 million NetFlow logs (plus a load of PCAP data that I have just ignored for the sake of my sanity) that contain a mix of normal, background, and botnet generated traffic. Like the best and most responsible academics, the awesome folks at the Czech Technical University essentially set off a load of bots on some of their servers and labelled up the flow logs, which makes it a great dataset for classifying botnet generated traffic.
[As a brief aside, if you want to know more about classification algorithms there’s a great blog here that presents some of the concepts and algorithms that are available.]
Using the approach suggested by Rafał Kozik and Michał Choraś the raw NetFlow logs have been aggregated into 60-second windows where statistics are calculated in each window for:
All six million of these aggregated records are contained in the app if you want to explore them yourself.
With this data the app will then walk you through a few steps:
I’ll be taking you through these steps in this blog.
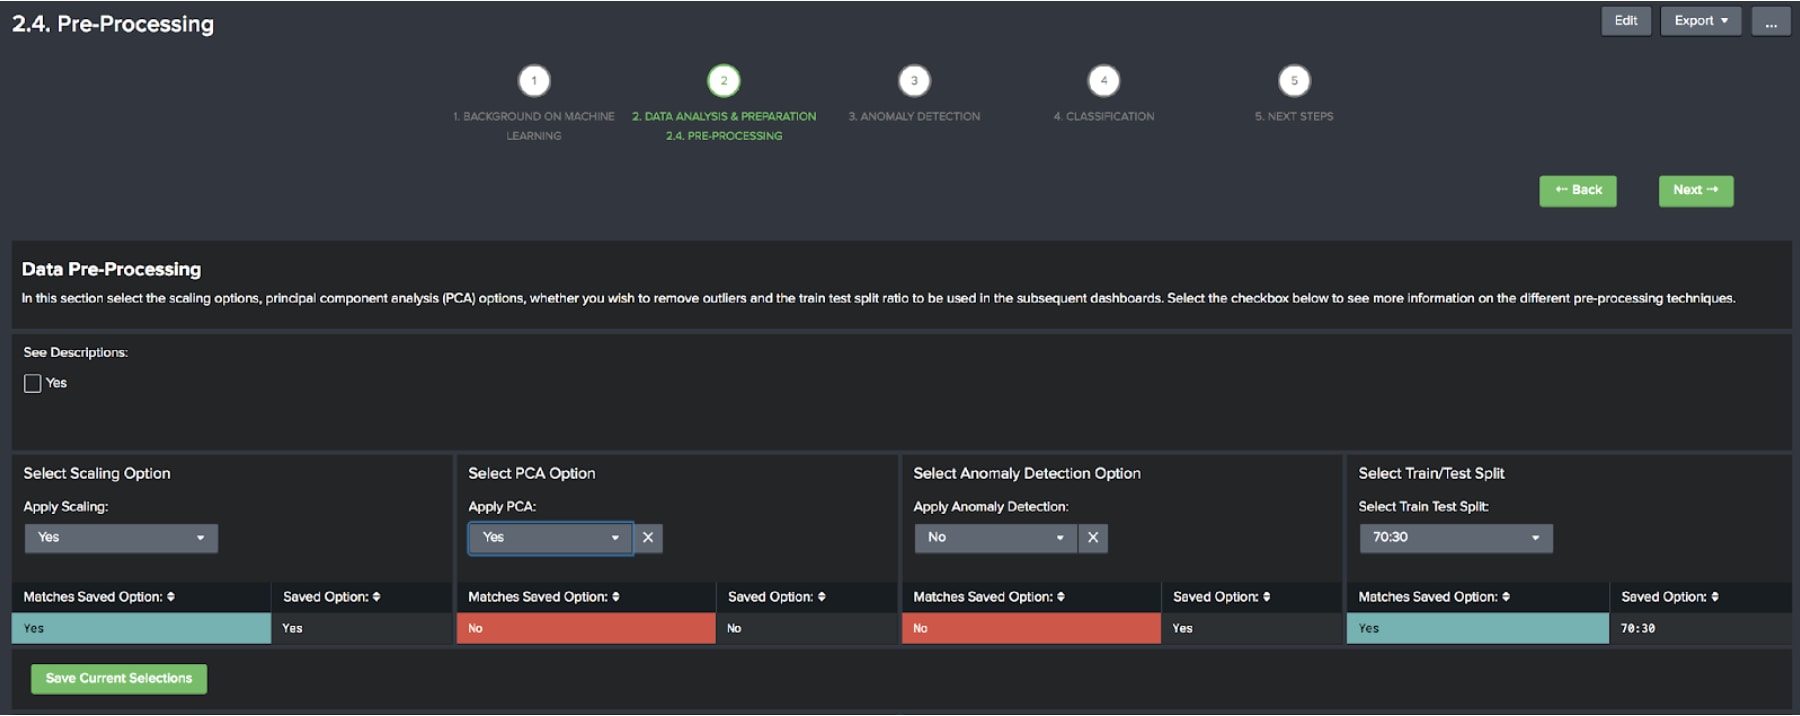
In this section of the app, you can explore the aggregate NetFlow records, generate a sample dataset and select the pre-processing options that you want to apply to the data.
Analysing the dataset is pretty self-explanatory, but from a machine learning point of view, you are trying to see if there are any relationships between the features of the data – the statistics that were calculated for each 60-second window – and the class of the data (botnet or not botnet). In particular, on the Exploratory Data Analysis dashboard, you should be able to see a clear separation between normal and botnet traffic on the Feature Analysis by Bot and Normal Traffic panel.
Another conclusion from the data analysis is that the proportion of non-botnet records to botnet records is extremely high. This is likely to produce models that are biased toward predicting non-botnet NetFlow traffic. Therefore, a dataset needs to be generated containing a more even split of botnet and non-botnet records. The app allows you to generate a sample dataset using undersampling that has a better balance of records.
At this point, we want to make a few decisions on how we are going to pre-process our data before applying an algorithm. There are several options:
It’s up to you how you choose to pre-process the data, make some selections and select save once you are happy.
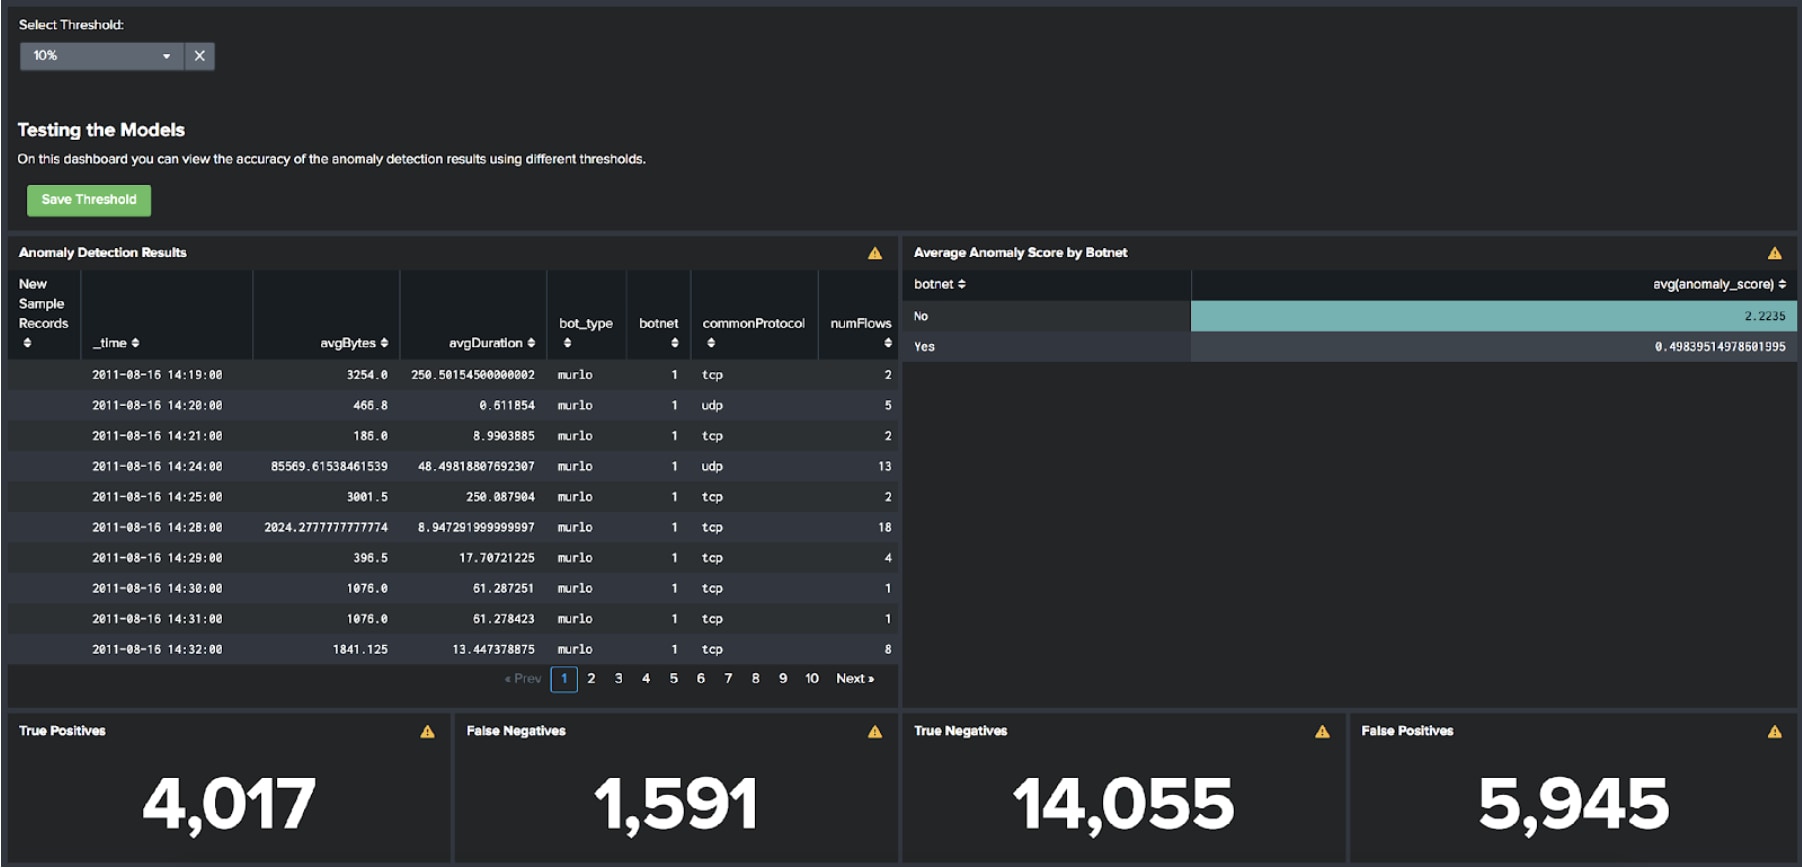
As mentioned above we are training an anomaly detection model on the botnet traffic in this instance, which isn’t how I would do this in production – you’d want to find a good set of flow logs that represent normal for your environment to train an anomaly detection model on.
Regardless of this, the dashboards in the app present a workflow for training and testing a set of anomaly detection models. You should see that anomaly detection alone is a good technique for detecting botnets, but can produce a vast number of false positives – normal traffic that has been incorrectly flagged as anomalous. Feel free to explore the differences in the results by changing the threshold and save the threshold that you think is the most accurate.
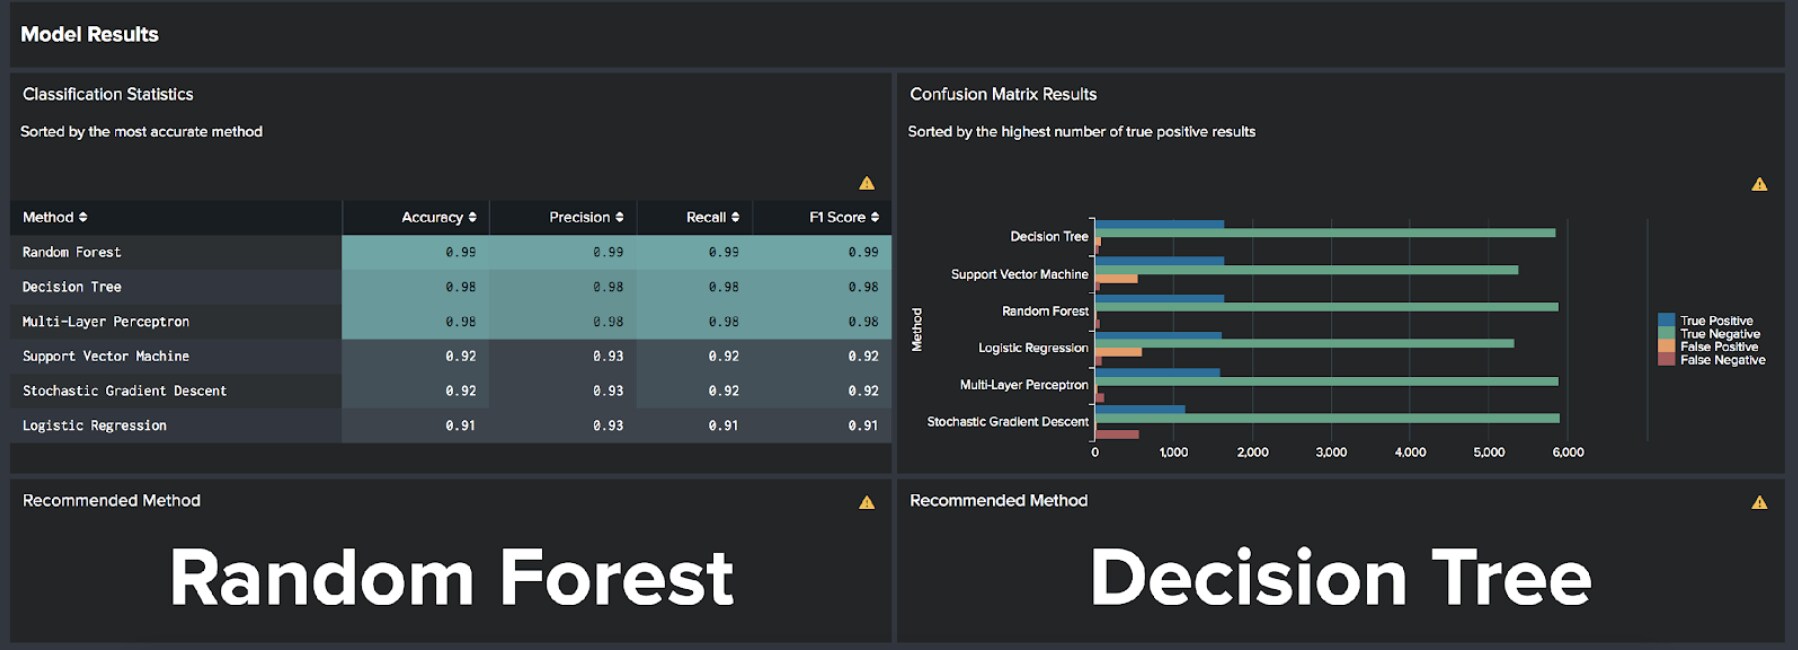
Now we’ve done our analysis, selected some pre-processing options, and found some anomalies it’s time to train our botnet classifier. You should be able to see the most recent selections made for model training and the most recent selections saved on the pre-processing dashboard – if they differ feel free to train a new model!
Once trained you can view the statistics about accuracy for each of the algorithms used in the app: Logistic Regression, Decision Tree, Random Forest, Support Vector Machine, Stochastic Gradient Descent, or Multi-Layer Perceptron. A recommendation will be made for the most accurate algorithm and for the algorithm that has the highest number of true positive results. Pay attention to the false positive number as well – this is effectively the number of false alarms you might get.
Once you’re happy with the results and want to productionise the models there is another dashboard – Next Steps & Productionisation – that can help you generate the SPL to apply the models in production.
Over to you now to implement a botnet detection algorithm on your infrastructure…
Happy Splunking.
Greg

The Splunk platform removes the barriers between data and action, empowering observability, IT and security teams to ensure their organizations are secure, resilient and innovative.
Founded in 2003, Splunk is a global company — with over 7,500 employees, Splunkers have received over 1,020 patents to date and availability in 21 regions around the world — and offers an open, extensible data platform that supports shared data across any environment so that all teams in an organization can get end-to-end visibility, with context, for every interaction and business process. Build a strong data foundation with Splunk.

Get the latest articles from Splunk straight to your inbox.
© 2005 - 2024 Splunk Inc. All rights reserved.
