
Digital Resilience Pays Off
Download this e-book to learn about the role of Digital Resilience across enterprises.

SignalFx is now integrated with RabbitMQ. We monitor RabbitMQ using collectd and the collectd-rabbitmq plugin we wrote.
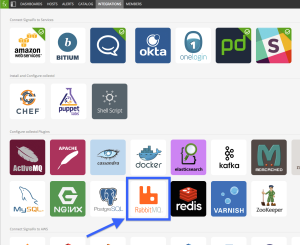 To get started, click on the RabbitMQ tile on the Integrations page in SignalFx. We supply the plugin for collectd, customizable configuration you can use for the plugin, documentation of all the metrics gathered, and built-in charts for RabbitMQ hosts, brokers, exchanges, and queues.
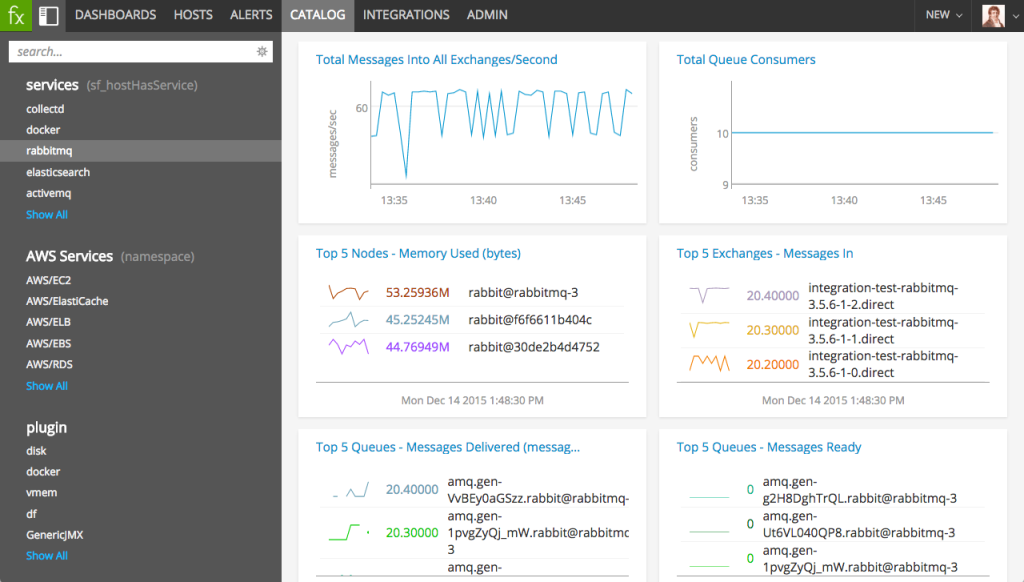
You can find built-in dashboards for RabbitMQ in the Catalog, by clicking rabbitmq under services in the left column. The RabbitMQ overview dashboard shows the status of all RabbitMQ hosts reporting to SignalFx. It includes metrics such as the rate of all incoming messages, and the top loaded RabbitMQ hosts.
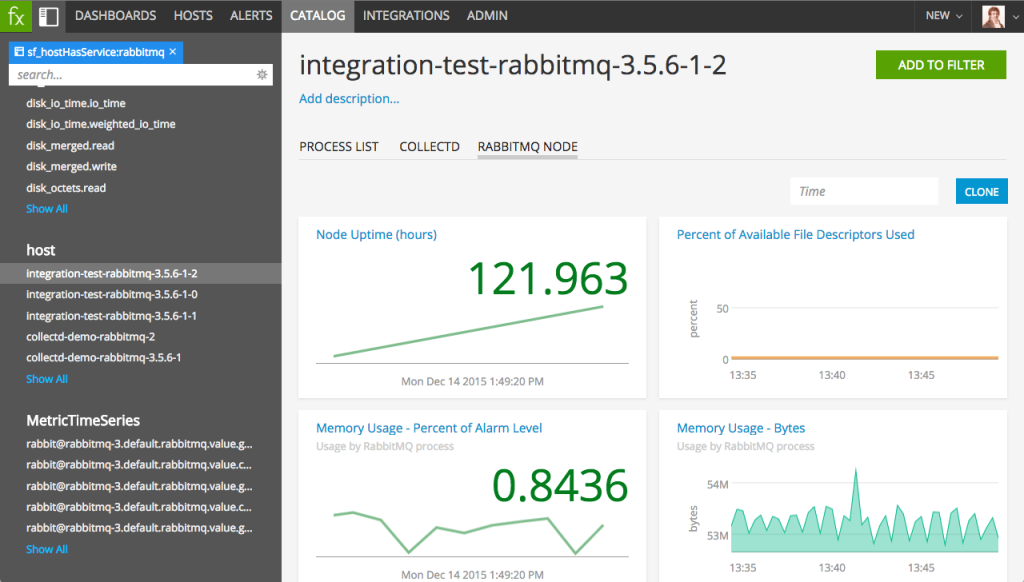
Select a specific host to show the status of individual nodes, including node uptime, usage of resources like memory and file descriptors, and the top queues by messages waiting for delivery.
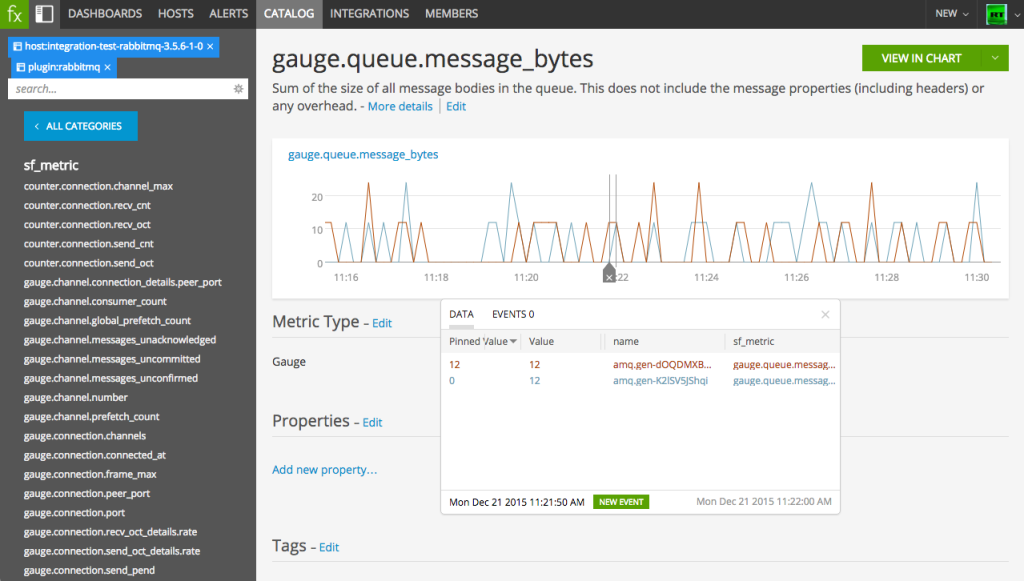
For an in-depth look at the performance of a specific queue or exchange, select it under name in the left-hand column to see all the metrics available for that queue or exchange. For example, you monitor the size of each queue in bytes.
 Start a free trial to begin monitoring RabbitMQ with SignalFx today!

The Splunk platform removes the barriers between data and action, empowering observability, IT and security teams to ensure their organizations are secure, resilient and innovative.
Founded in 2003, Splunk is a global company — with over 7,500 employees, Splunkers have received over 1,020 patents to date and availability in 21 regions around the world — and offers an open, extensible data platform that supports shared data across any environment so that all teams in an organization can get end-to-end visibility, with context, for every interaction and business process. Build a strong data foundation with Splunk.

Get the latest articles from Splunk straight to your inbox.
© 2005 - 2024 Splunk Inc. All rights reserved.
