
Digital Resilience Pays Off
Download this e-book to learn about the role of Digital Resilience across enterprises.
When there is an incident or if a customer-facing system goes down, the first step is to access all associated data to uncover the issue and restore service immediately. However, there are massive challenges around the ability to get your hands on the required data for triaging an incident in a timely fashion to ensure customers or services aren’t impacted. For example, can you integrate one tool with your existing Amazon S3 or CloudWatch setup and start polling for data right away? Can you customize your data before it is actually ingested? Can all this be done in just a few minutes? Let’s face it, patience is not everyone’s strongest suit and the potential for losing customers increases with each passing minute.
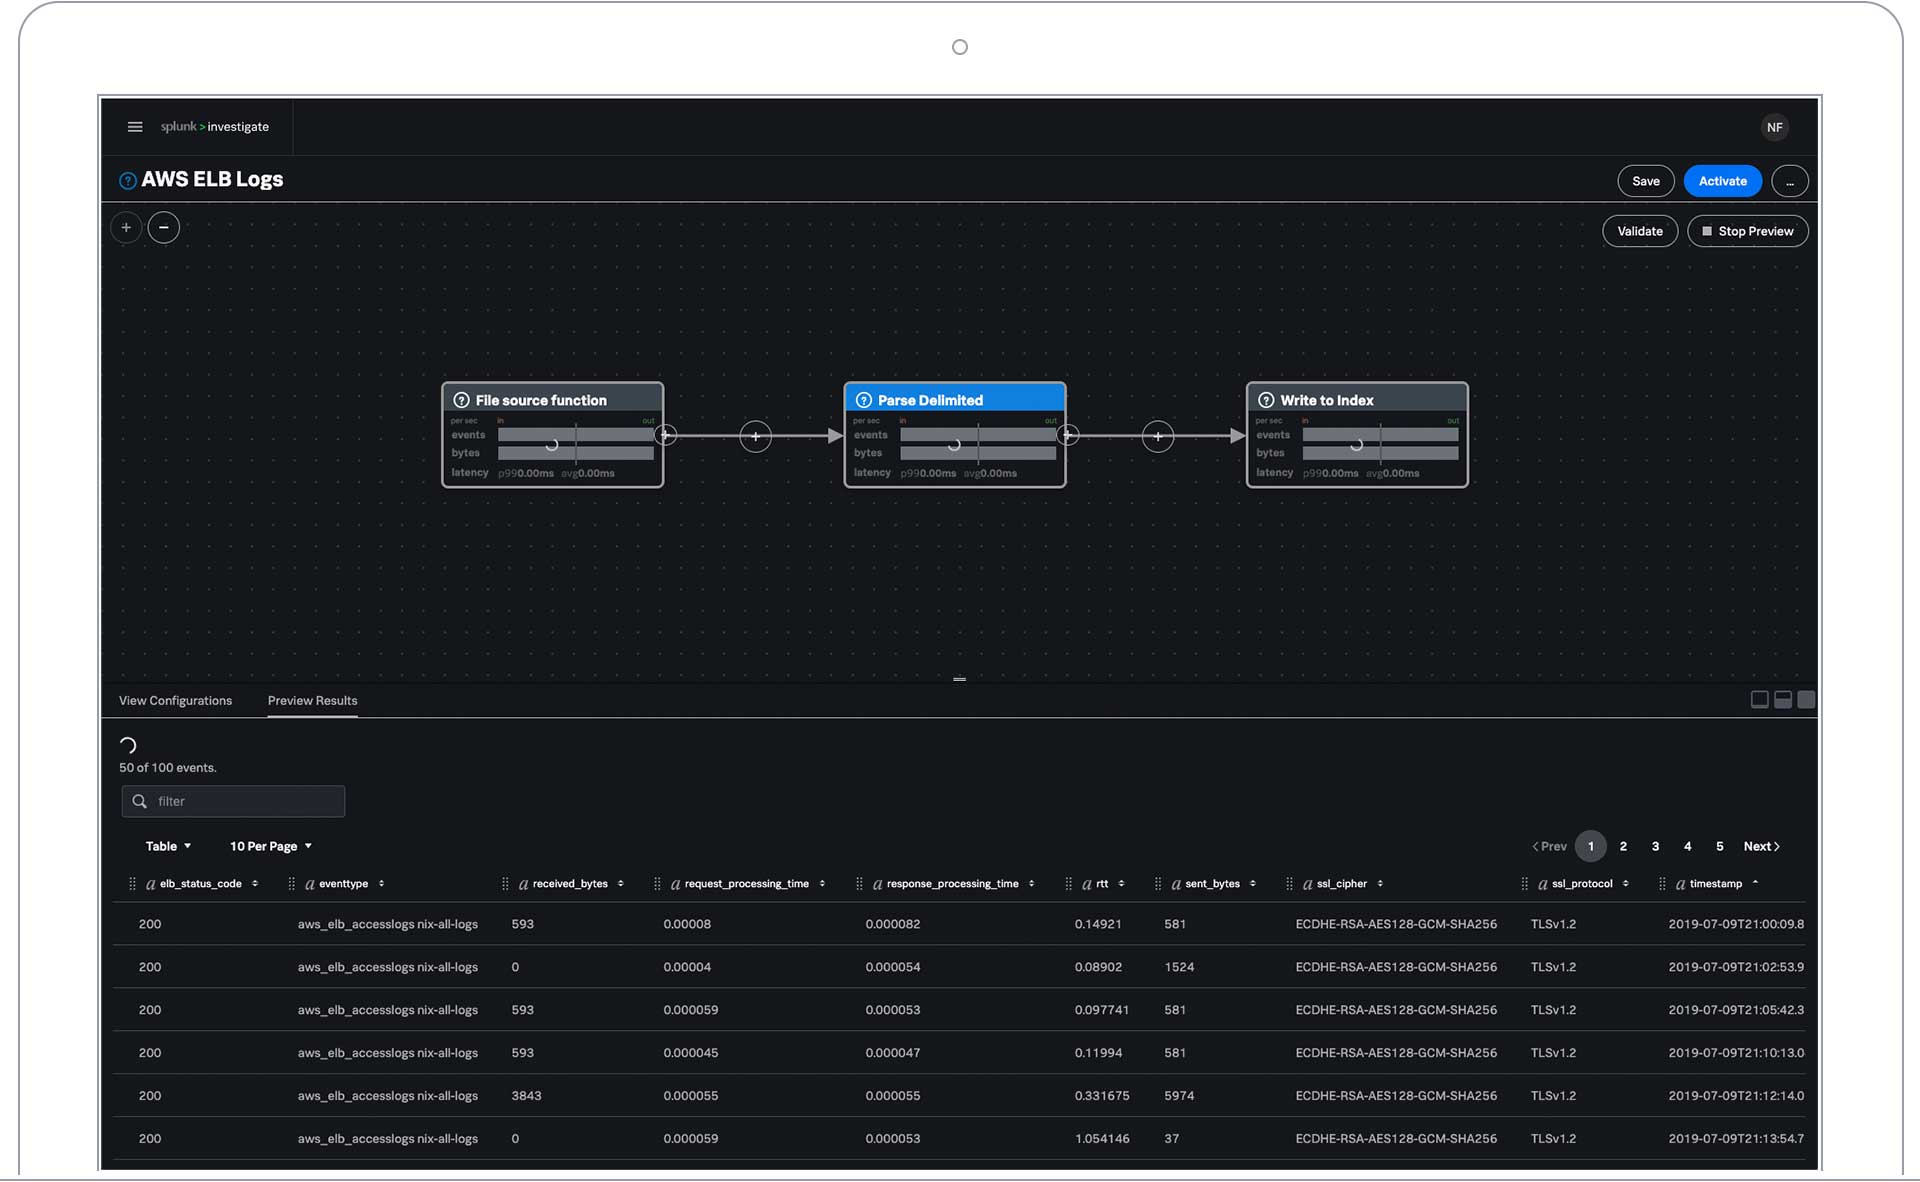
The good news is that the answer to these questions can be 'YES!' In October of this year, we launched Splunk Investigate and have received great feedback on how this solution helps modern app-dev teams accelerate the time to incident resolution. Getting data in (GDI) using Splunk Investigate is a quick three step process highlighted below.
Out-of-the-box connectors allow you to seamlessly connect Splunk Investigate with other systems like Amazon S3, Cloudwatch and Kinesis. Simply select a data source and provide the credentials needed to configure the underlying connector that brings in data from the source. Additionally, you can configure the connection to run at certain times during the day so you always have the latest data. But that’s not all, there is no further set up required on your end: Just upload a Comma Separated Values (CSV) or Tab Separated Values (TSV) file by selecting “Upload File” as your data source and go from there.
For data preparation, it can be helpful to think of your data as a stream. You can apply various functions to this incoming stream, such as: “add,” “rename” or “delete” fields, change field formats, extract new fields (you get the idea) and preview those customizations as you go. Don’t worry, you’re also allowed to undo those customizations in case you don’t like what you see.
Once you are happy with what your incoming data looks like, all you have to do is name the pipeline and send that data to Splunk Investigate. All done!
Now that you have access to all your critical data in one place, you can start your collaborative investigation and get your application or service back online. Go ahead, enjoy that cup of tea (or coffee) and watch your worries melt away as you find the root cause and resolve production quickly.
Get started today with your free 14-day trial of Splunk Investigate.

The Splunk platform removes the barriers between data and action, empowering observability, IT and security teams to ensure their organizations are secure, resilient and innovative.
Founded in 2003, Splunk is a global company — with over 7,500 employees, Splunkers have received over 1,020 patents to date and availability in 21 regions around the world — and offers an open, extensible data platform that supports shared data across any environment so that all teams in an organization can get end-to-end visibility, with context, for every interaction and business process. Build a strong data foundation with Splunk.

Get the latest articles from Splunk straight to your inbox.
© 2005 - 2024 Splunk Inc. All rights reserved.
