WEBINAR
Splunk + AppDynamics: The Future of Observability
Troubleshoot performance and security issues faster, with less toil. Avoid negative impact on your business and customers. See how Splunk and AppDynamics unify visibility and align teams.

Splunk AppDynamics delivers full-stack observability linked to business performance for hybrid and three-tier applications.
We’re unlocking new use cases, delivering new features, and implementing integrations with other Splunk products, all powered by AI that accelerates troubleshooting and resolution across teams. Use the products that meet your requirements — no migration needed.
Deliver peak performance with unique AppDynamics capabilities:
AppDynamics is expanding observability for hybrid and on-prem applications. Cisco is investing in observability as a key product strategy and prioritizing a streamlined, AI-powered experience for AppDynamics and the Splunk Observability portfolio.
Use just AppDynamics or AppDynamics and other Splunk products.
Ensure ITOps, Engineering, Network, and Security teams see across:
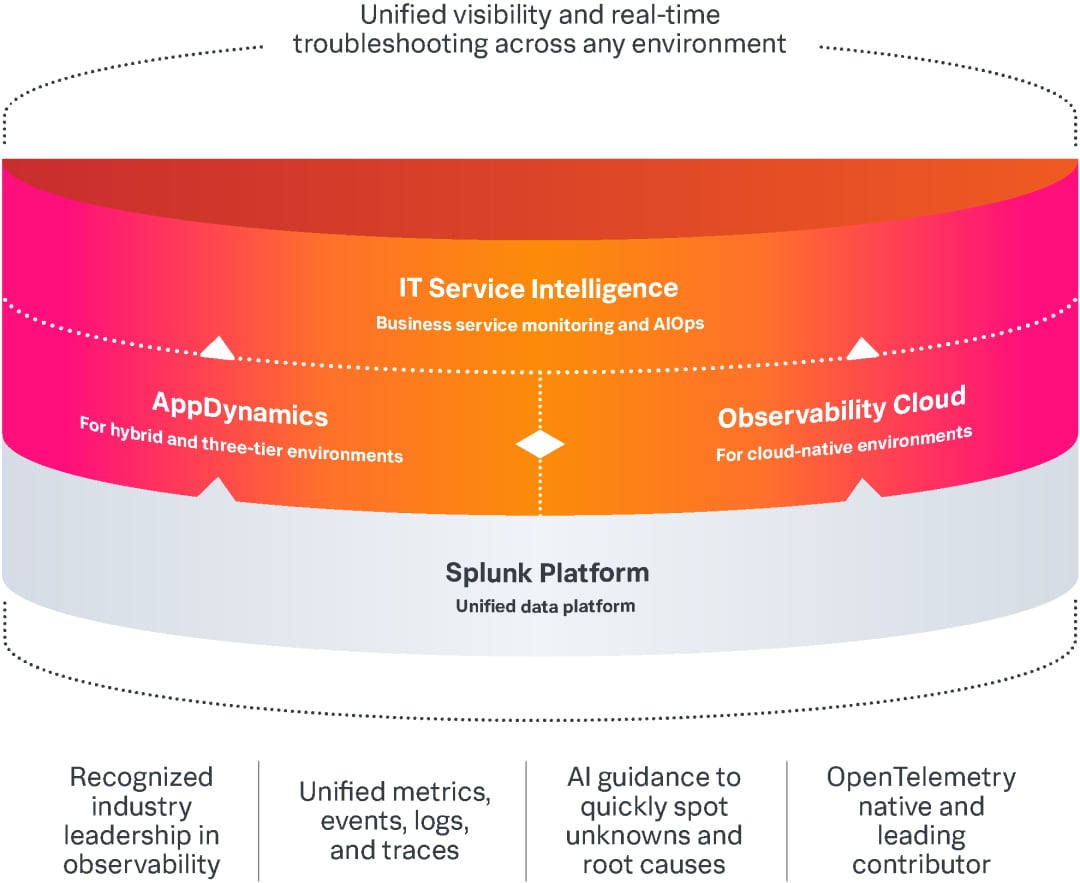
Achieve full-stack observability with unified visibility across any environment, any stack:
Integration of AppDynamics and Splunk will allow us to make further use of Splunk AI features to analyze our security infrastructure and application data, identify trends and generate critical action items across environments.
Cisco is investing in observability as a key pillar of its product strategy. AppDynamics is a critical part of our business.
We’re prioritizing a unified, streamlined experience across the portfolio of AppDynamics and Splunk offerings. Cisco is combining AppDynamics, Splunk Platform, Observability Cloud, and IT Service Intelligence into a single portfolio called Splunk Observability. This portfolio combines AppD’s unparalleled visibility and business insights across 3-tier/n-tier applications with Splunk’s industry-defining log analytics and best-in-class cloud-native observability. No migration is required.
Splunk’s Observability portfolio consists of the Splunk platform, Splunk AppDynamics, Splunk Observability Cloud, and Splunk IT Service Intelligence. The combined portfolio is complementary:
Yes! We support the continued need for business-focused observability for hybrid and multi-tier applications. For business, regulatory, and other reasons, many organizations choose not to refactor these applications to be microservices-centric.
In addition to a robust individual product roadmap of features and enhancements, we are enhancing integrations between AppDynamics, Splunk platform, Splunk Observability Cloud, and Splunk IT Service Intelligence. Many integration capabilities are available now.
Nope! AppDynamics is a critical component of the Splunk Observability portfolio. It is a foundational enabler that helps our customers achieve full-stack observability for their hybrid and three-tier application environments.
The integrations and unified experience spanning the Splunk Observability portfolio enable AppDynamics to harness the capabilities of the Splunk platform, Splunk Observability Cloud, and Splunk IT Service Intelligence.
AppDynamics customers can quickly and seamlessly centralize log analytics to control costs, group related alerts from any source to reduce noise, correlate IT service health with business KPIs, and monitor and troubleshoot cloud-native environments.
Additionally, unified AI-powered capabilities are coming soon across the portfolio. AppDynamics customers can streamline workflows and get even more value from their AppDynamics deployment and their overall observability investments.
We changed the name to reflect that AppDynamics is an important part of the Splunk Observability portfolio. Cisco acquired Splunk in March 2024.
Integration throughout the portfolio is underway, focusing on
Available now, Log Observer Connect for AppDynamics delivers context-preserving deep linking between AppDynamics and Splunk platform. AppDynamics application alerts and metrics are already integrated into ITSI for alert noise reduction and service health.


