
AIでセキュリティ分析をレベルアップ
AIが脅威の調査と対応の効果向上にどのように役立つかについてご紹介します。

このブログでは、Splunkを使ったMCPサーバーのセキュリティ監視の方法をご紹介します。MCPはAnthropic社が開発した新しいテクノロジーで、ローカルアプリケーションと大規模言語モデル(LLM)との間のブリッジの役割を果たします。
MCP (Model Context Protocol)は、AIがさまざまなシステム(社内データベース、ファイルシステム、Web API、その他のソフトウェアツール)と安全に「対話」できるようにするための、万能な通訳者のような存在です。AIシステムごとにあらゆるデータソースに合わせた個別の統合を構築する必要はなく、MCPが共通の言語とルールを提供します。
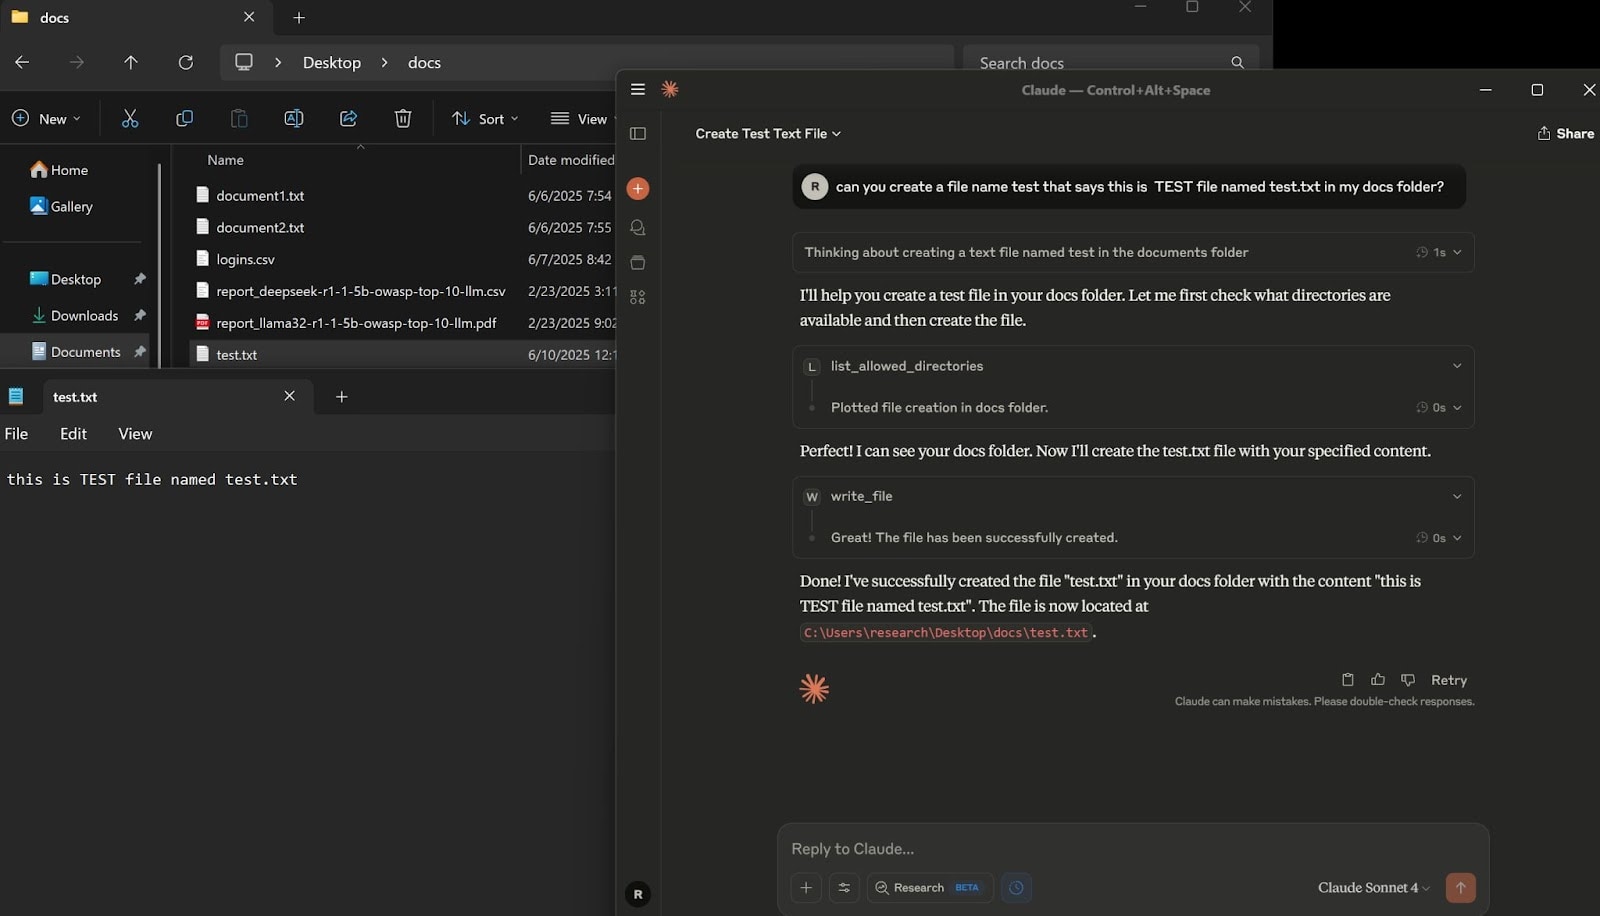
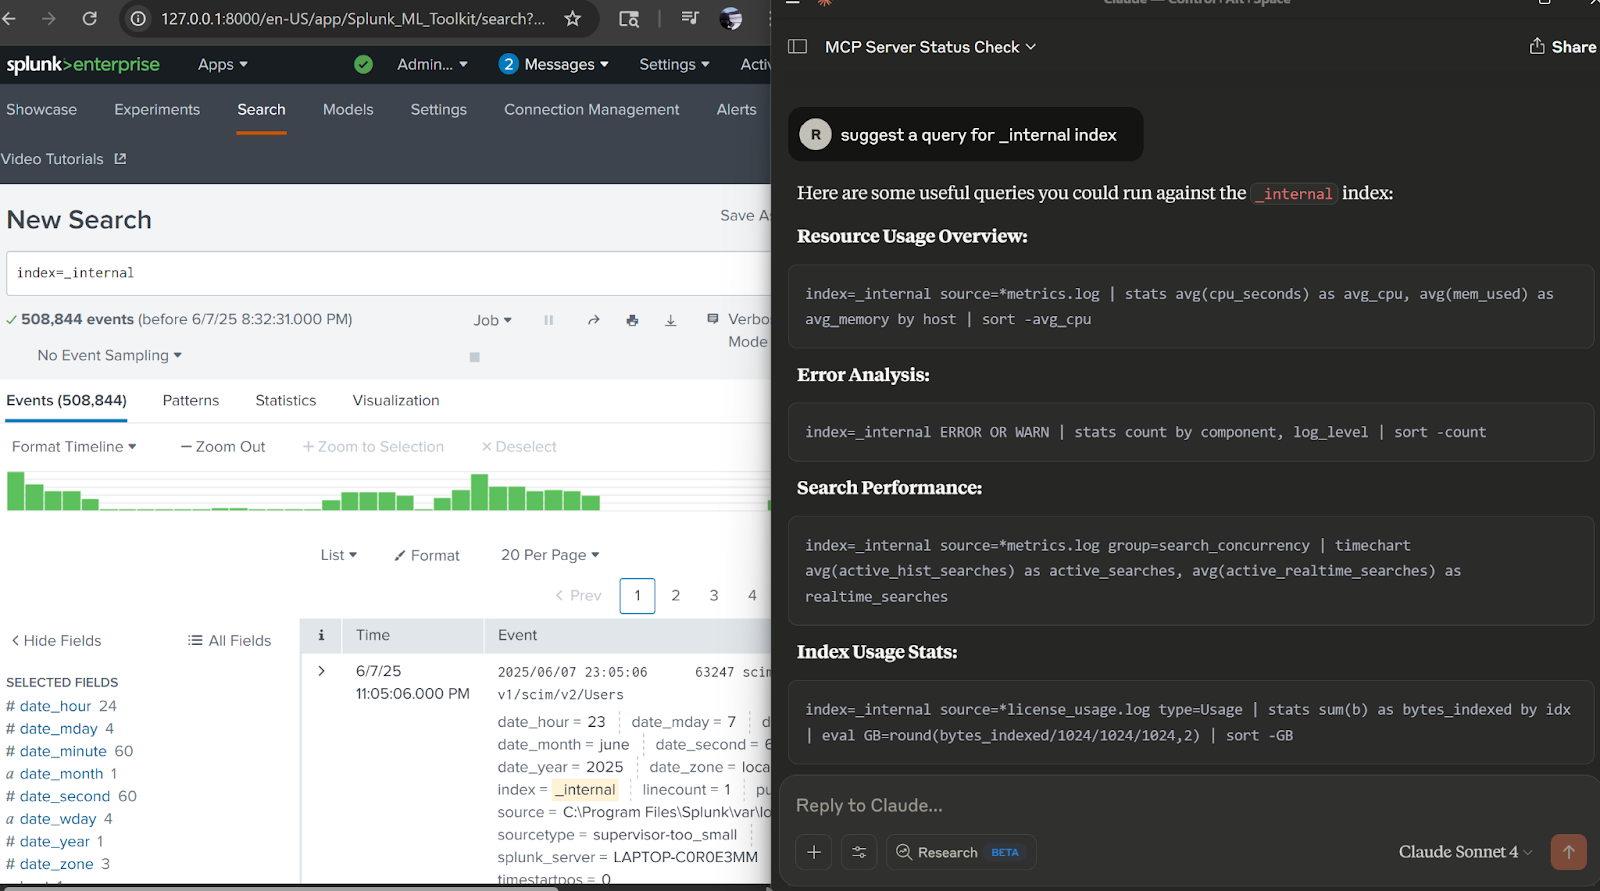
MCPの開発ではAnthropic社が中心的な役割を果たし、MCPに対するサポートも最も成熟していますが、このプロトコルはAIエコシステム全体でより広く利用されることを目的として設計されています。以下の画面は、MCPサーバーを実際に使用している様子を示しています。この画面では、ユーザーがClaude LLMに対して、指定したフォルダーにローカルファイルを作成するように指示しています。Claude LLMはクラウドで運用されていますが、MCPサーバーを介して、ユーザーのコンピューターでローカルな操作を実行できます。
MCPを使用することで、AIはさまざまなシステム(社内データベース、ファイルシステム、Web API、その他のソフトウェアツール)と安全に「対話」できます。この機能により、MCPの利用可能な用途が注目を集め、その人気が高まった結果、特定のアプリケーション向けに対応した複数のMCPサーバーの開発が進められました。
このブログでは、オペレーティングシステムとの直接的なやり取りとSplunkの操作にMCPを使用し、そこから、このテクノロジーを利用するうえでのセキュリティ上の課題を探っていきます。
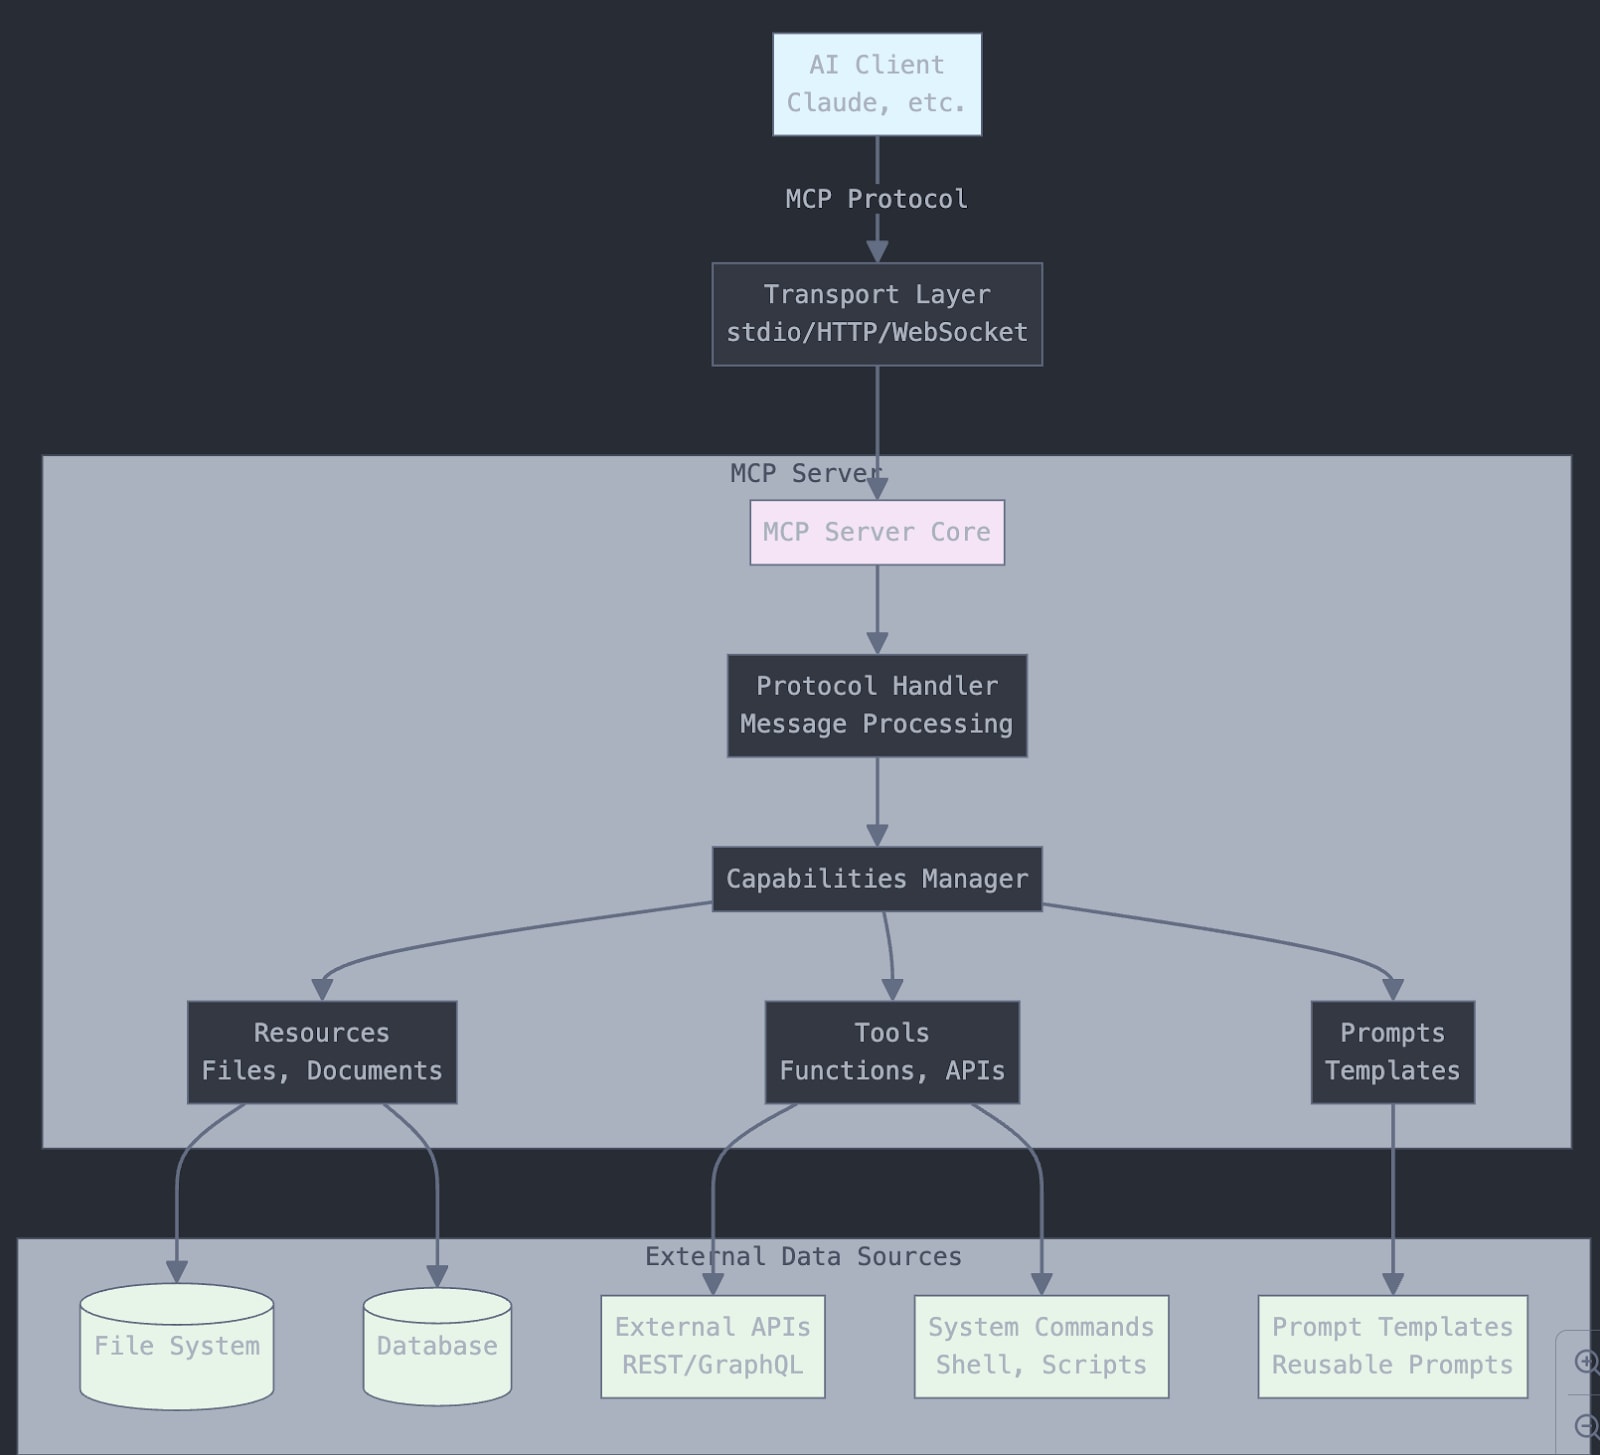
最上位層(Client):
Transport Layer:
MCP Server Core:
External Data Sources:
サーバーは、AIとデータ/ツール間を安全につなぐ役割を果たします。
このブログでは、私がGitHubで公開しているコードを基にしたMCPサーバーを使用します。このコードでは、ファイル操作MCPとSplunk MCPサーバーの構築ができます。その後、これらのMCPサーバーの使用中に生成されるログを分析して、MCPサーバーを監視する方法を検討します。
この調査では、2つのMCPサーバーを構築します。1つはファイル操作MCPサーバーで、指定したフォルダーに接続し、ファイルの一覧表示と読み書きができます。もう1つがSplunk MCPサーバーで、Splunkインスタンスに接続し、SPLクエリーの実行、インデックスの読み取り、さらにアプリケーション関連クエリーの実行ができます。これらの操作は、アクセス権やユーザーの権限によって制限される場合があることに注意してください。たとえば、ファイル操作MCPサーバーを使用する場合、Claudeデスクトップでは、ローカルシステムで要求されたアクションを許可するかどうかを尋ねられます。Splunkでは、アカウントとロールの権限の機能によってこの制限に対処できます。2つのMCPサーバーはいずれも、NVIDIA 4070 GPUと32GBのRAMを搭載したWindows 11マシンにインストールします。
これから、2つのMCPサーバーの使用中に作成されたログファイルを見ていきます。ここではクライアント(Claudeデスクトップを実行しているコンピューター)に焦点を当てます。この環境では、ログは「C:\Users\--user–\AppData\Roaming\Claude\logs\」に作成されます。
main.log
window.log
mcp-server-filesystem.log
mcp-server-splunk.log
一般的なMCPサーバーログ
以前のブログ「SplunkでローカルLLMのセキュリティを監視する方法(パートII)」で説明したように、AI/モデルを保護するために監視すべき領域は基本的に3つあります。
ここでは、MCPデスクトップアプリケーションがクライアントとして機能し、MCPサーバーがそのクライアントとモデル(ローカルまたはクラウドで運用)との間のブリッジの役割を果たします。そして、監視する必要があるのは、MCPブリッジアプリケーションの使用状況(上記のタイプのログ)と、このMCPサーバーを実行しているホスト(MCPサーバーログ)です。
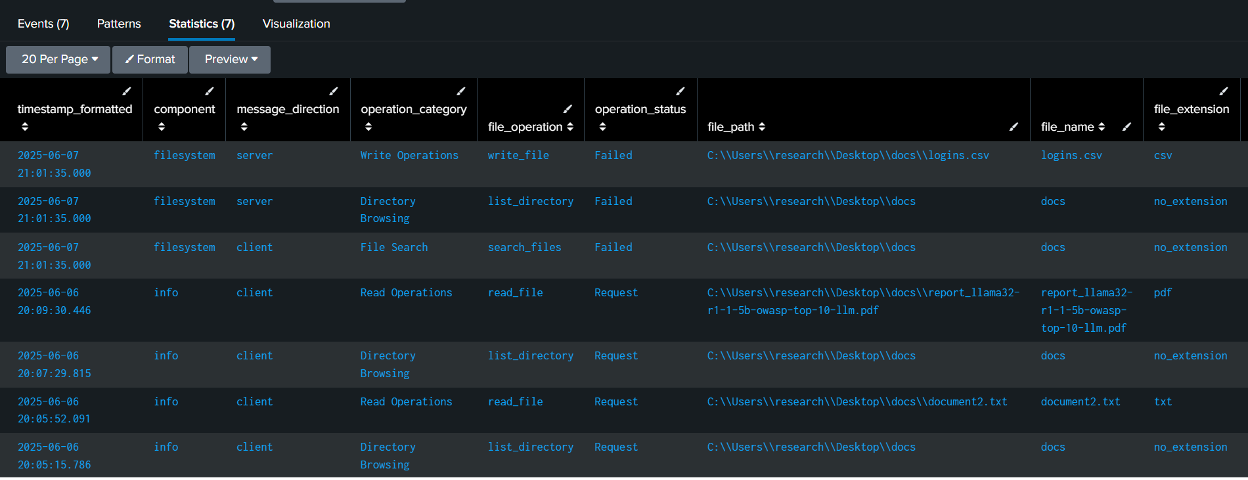
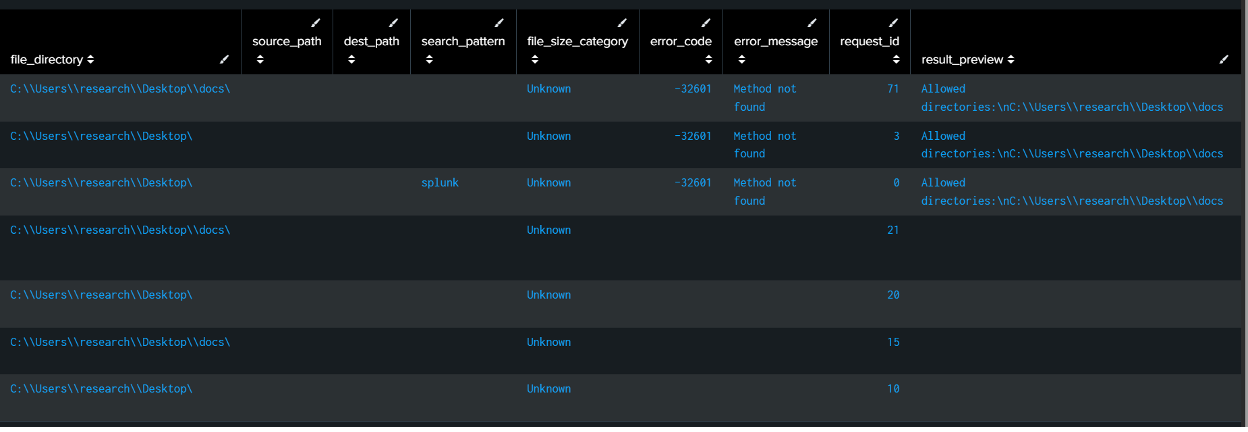
システムの構成と監視すべきログを確認したので、次に、MCPサーバーの特定の情報を監視するためのSPLサーチを確認しましょう。
SPLコード - ファイル操作
index=* (sourcetype=*mcp* OR source=*mcp* OR source=*filesystem*)
    ("tools/call" OR "read_file" OR "write_file" OR "list_directory" OR "get_file_info" OR "create_directory" OR "move_file" OR "search_files" OR "directory_tree" OR "edit_file")
| rex field=_raw "\"method\":\"tools/call\",\"params\":{\"name\":\"(?P<file_operation>[^\"]+)\",\"arguments\":{(?P<full_arguments>[^}]+)}"
| rex field=full_arguments "\"path\":\"(?P<file_path>[^\"]+)\""
| rex field=full_arguments "\"content\":\"(?P<file_content>[^\"]{0,100})"
| rex field=full_arguments "\"source\":\"(?P<source_path>[^\"]+)\""
| rex field=full_arguments "\"destination\":\"(?P<dest_path>[^\"]+)\""
| rex field=full_arguments "\"pattern\":\"(?P<search_pattern>[^\"]+)\""
| rex field=full_arguments "\"paths\":\[(?P<multiple_paths>[^\]]+)\]"
| rex field=_raw "\"id\":(?P<request_id>[^,}]+)"
| rex field=_raw "\[(?P<component>\w+)\]\s+\[(?P<log_level>\w+)\]"
| rex field=_raw "Message from (?P<message_direction>client|server)"
| rex field=_raw "\"result\":{\"content\":\[{\"type\":\"text\",\"text\":\"(?P<result_preview>[^\"]{0,200})"
| rex field=_raw "\"error\":{\"code\":(?P<error_code>[^,]+),\"message\":\"(?P<error_message>[^\"]+)\""
| where isnotnull(file_operation) AND match(file_operation, "read_file|write_file|list_directory|get_file_info|create_directory|move_file|search_files|directory_tree|edit_file|read_multiple_files")
| eval operation_category=case(
    match(file_operation, "read_file|read_multiple_files"), "Read Operations",
    match(file_operation, "write_file|edit_file"), "Write Operations",
    match(file_operation, "list_directory|directory_tree"), "Directory Browsing",
    match(file_operation, "search_files"), "File Search",
    match(file_operation, "get_file_info"), "File Information",
    match(file_operation, "create_directory"), "Directory Management",
    match(file_operation, "move_file"), "File Movement",
    true(), "Other Operations"
)
| eval file_extension=if(isnotnull(file_path) AND match(file_path, "\."),
    replace(file_path, ".*\.([^\.\\\\]+)$", "\1"),
    if(isnotnull(file_path), "no_extension", "N/A"))
| eval file_directory=if(isnotnull(file_path),
    replace(file_path, "^(.*)[\\\\/][^\\\\/]+$", "\1"),
    "N/A")
| eval file_name=if(isnotnull(file_path),
    replace(file_path, "^.*[\\\\/]([^\\\\/]+)$", "\1"),
    "N/A")
| eval operation_status=case(
    isnotnull(error_code), "Failed",
    isnotnull(result_preview), "Success",
    message_direction="server", "Response",
    true(), "Request"
)
| eval file_size_category=case(
    match(result_preview, "size:\s*(\d+)") AND tonumber(replace(result_preview, ".*size:\s*(\d+).*", "\1")) > 1000000, "Large (>1MB)",
    match(result_preview, "size:\s*(\d+)") AND tonumber(replace(result_preview, ".*size:\s*(\d+).*", "\1")) > 100000, "Medium (100KB-1MB)",
    match(result_preview, "size:\s*(\d+)"), "Small (<100KB)",
    true(), "Unknown"
)
| eval timestamp_formatted=strftime(_time, "%Y-%m-%d %H:%M:%S.%3N")
| eval hour_of_day=strftime(_time, "%H")
| eval day_of_week=strftime(_time, "%A")
| sort -_time
| table timestamp_formatted, component, message_direction, operation_category, file_operation, operation_status, file_path, file_name, file_extension, file_directory, source_path, dest_path, search_pattern, file_size_category, error_code, error_message, request_id, result_preview
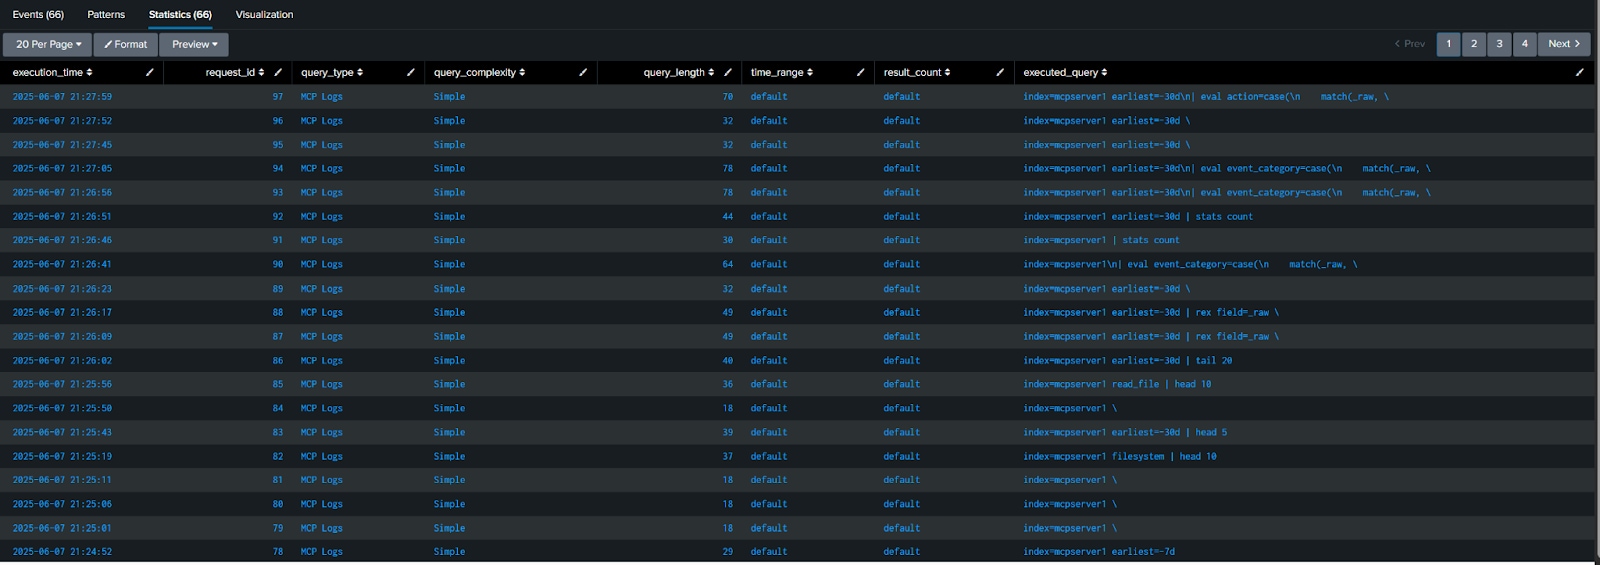
SPLコード - MCPサーバー経由で実行されるSplunkクエリー
index=main sourcetype=mcpjson "tools/call" "splunk_search"
| rex field=_raw "\"query\":\"(?P<executed_query>[^\"]+)\""
| rex field=_raw "\"id\":(?P<request_id>[^,}]+)"
| rex field=_raw "\"earliest_time\":\"(?P<time_range>[^\"]+)\""
| rex field=_raw "\"count\":(?P<result_count>[^,}]+)"
| where isnotnull(executed_query)
| eval query_type=case(
    match(executed_query, "(?i)index=\\*"), "Cross-Index Search",
    match(executed_query, "(?i)index=_internal"), "Internal Logs",
    match(executed_query, "(?i)index=main"), "Main Index",
    match(executed_query, "(?i)index=mcp"), "MCP Logs",
    match(executed_query, "(?i)\\| rest"), "REST API Call",
    match(executed_query, "(?i)\\| makeresults"), "Data Generation",
    match(executed_query, "(?i)\\| inputlookup"), "Lookup Table",
    match(executed_query, "(?i)predict"), "Machine Learning",
    match(executed_query, "(?i)stats|eval|where"), "Data Analysis",
    true(), "Other"
)
| eval query_complexity=case(
    len(executed_query) > 200, "Complex",
    len(executed_query) > 100, "Medium",
    true(), "Simple"
)
| eval execution_time=strftime(_time, "%Y-%m-%d %H:%M:%S")
| eval query_length=len(executed_query)
| eval time_range=coalesce(time_range, "default")
| eval result_count=coalesce(result_count, "default")
| table execution_time, request_id, query_type, query_complexity, query_length, time_range, result_count, executed_query
| sort -_time
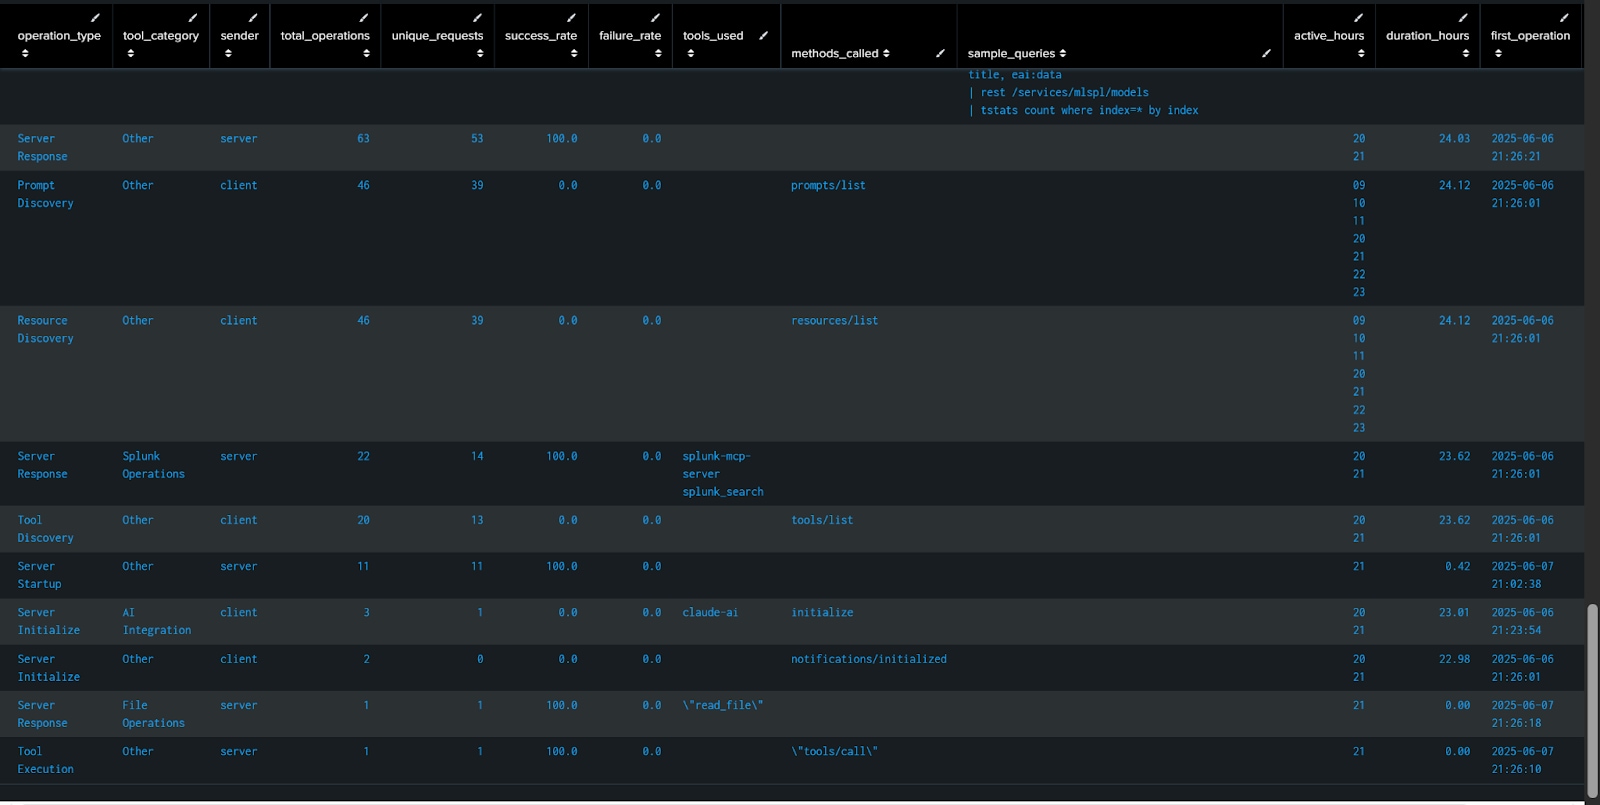
SPLコード - MCPサーバーの操作
index=main sourcetype=mcpjson
| rex field=_raw "\"method\":\"(?P<method>[^\"]+)\""
| rex field=_raw "\"name\":\"(?P<tool_name>[^\"]+)\""
| rex field=_raw "Message from (?P<sender>server|client)"

| rex field=_raw "\"id\":(?P<request_id>[^,}]+)"
| rex field=_raw "\"error\":\{\"code\":(?P<error_code>[^,]+)"
| rex field=_raw "\"query\":\"(?P<splunk_query>[^\"]{1,100})"
| eval operation_type=case(
    match(method, "tools/call"), "Tool Execution",
    match(method, "tools/list"), "Tool Discovery",
    match(method, "initialize"), "Server Initialize",
    match(method, "notifications/initialized"), "Initialization Complete",
    match(method, "prompts/list"), "Prompt Discovery",
    match(method, "resources/list"), "Resource Discovery",
    match(_raw, "Initializing"), "Server Startup",
    isnotnull(error_code), "Error Response",
    sender="server" AND isnull(method), "Server Response",
    sender="client" AND isnull(method), "Client Request",
    true(), "Unknown"
)
| eval tool_category=case(
    match(tool_name, "splunk"), "Splunk Operations",
    match(tool_name, "read_file|write_file|list"), "File Operations",
    match(tool_name, "claude"), "AI Integration",
    true(), "Other"
)
| eval success_status=case(
    isnotnull(error_code), "Failed",
    match(_raw, "\"result\""), "Success",
    true(), "Pending"
)
| eval hour_of_day=strftime(_time, "%H")
| eval day_of_week=strftime(_time, "%A")
| stats
    count as total_operations,
    dc(request_id) as unique_requests,
    values(tool_name) as tools_used,
    values(method) as methods_called,
    count(eval(success_status="Success")) as successful_ops,
    count(eval(success_status="Failed")) as failed_ops,
    values(error_code) as error_codes,
    values(splunk_query) as sample_queries,
    earliest(_time) as first_operation,
    latest(_time) as last_operation,
    values(hour_of_day) as active_hours,
    values(day_of_week) as active_days
    by operation_type, tool_category, sender
| eval
    success_rate=round((successful_ops/total_operations)*100, 1),
    failure_rate=round((failed_ops/total_operations)*100, 1),
    duration_hours=round((last_operation-first_operation)/3600, 2),
    first_operation=strftime(first_operation, "%Y-%m-%d %H:%M:%S"),
    last_operation=strftime(last_operation, "%Y-%m-%d %H:%M:%S")
| table operation_type, tool_category, sender, total_operations, unique_requests, success_rate, failure_rate, tools_used, methods_called, sample_queries, active_hours, duration_hours, first_operation, last_operation
| sort -total_operations
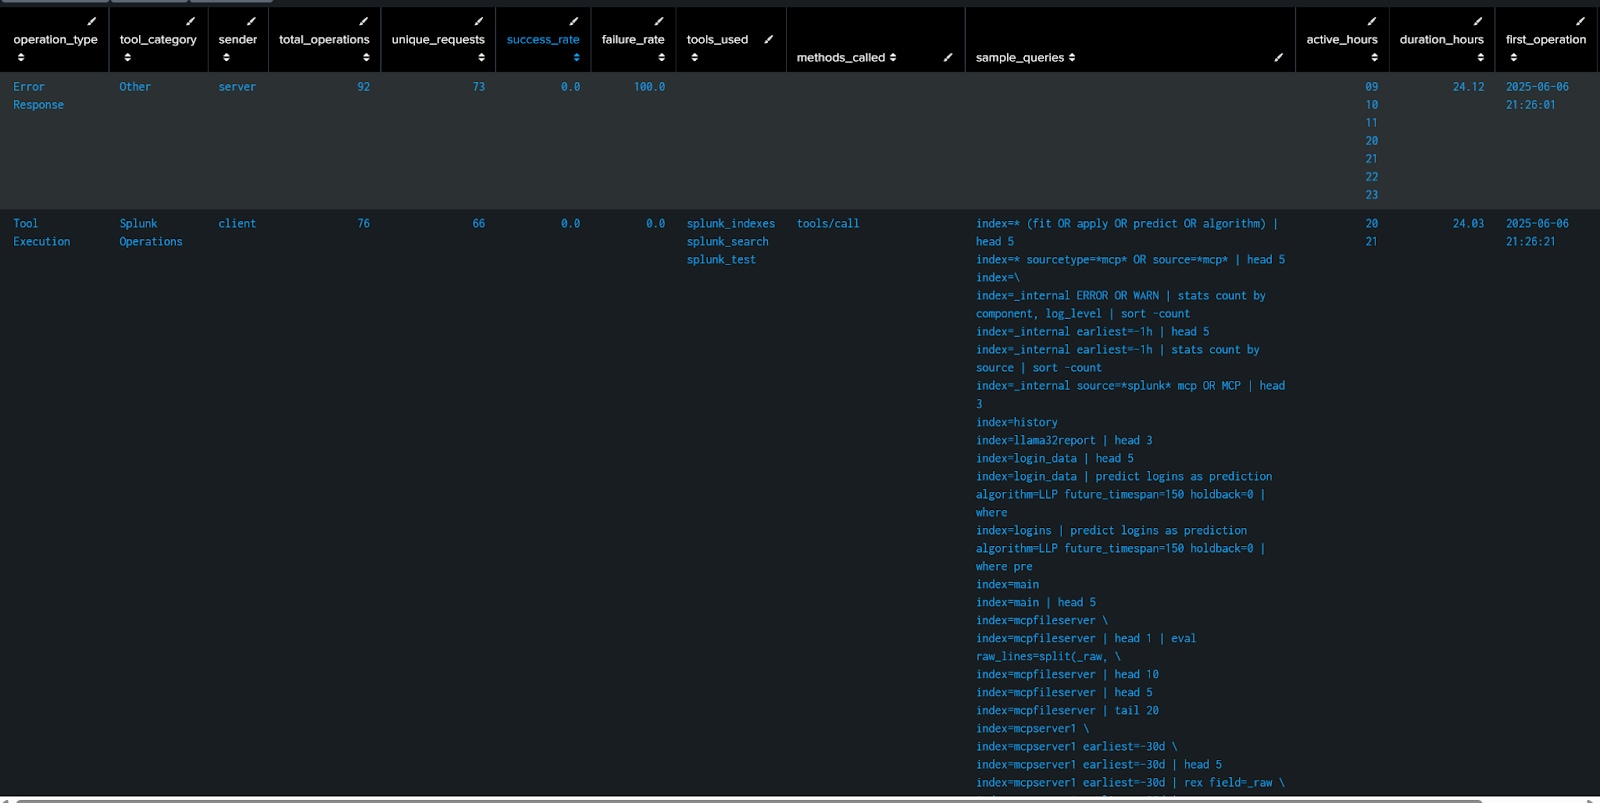
このように、MCPサーバーで生成されたデータをクライアントレベルで確実に監視できます。これらの情報と、以前のブログで説明したバックエンドログを組み合わせれば、クライアントとサーバーでのLLMモデルの使用状況について、プロンプトやデータ補完による直接的な使用だけでなく、クライアントやサーバーバックエンドが実行されているプラットフォームからの使用でも、包括的に把握できます。

© 2005 - 2026 Splunk LLC 無断複写・転載を禁じます。
© 2005 - 2026 Splunk LLC 無断複写・転載を禁じます。
