false

use case

Optimize end user experiences

Make sense of the hundreds of components that impact the end user to help you deliver a better experience.

Request a Demo
Free Trial
protect

challenge

Ensuring a consistent, optimal user experience is difficult

End-user experience depends on the interaction of hundreds of components that are the responsibility of multiple engineering teams. While each team optimizes their own components, they’re left to guess how the interaction of these components impacts the actual user experience.

solution

Optimize performance to deliver great customer experiences

See everything clearly See everything clearly

Detect issues proactively

Proactively monitor the entire user journey to ensure uptime and performance, and fix problems before they reach real users.

Cut production downtime Cut production downtime

Correlate from the frontend to the backend

Avoid context switching and blind spots with end-to-end visibility of all your data sources and types, from web browsers to backend services.

Accelerate new use cases Accelerate new use cases

Automatically fine-tune performance

Continuously detect issues and prioritize improvements with integrated alerting and industry-standard user experience and SEO metrics on setup.

protect

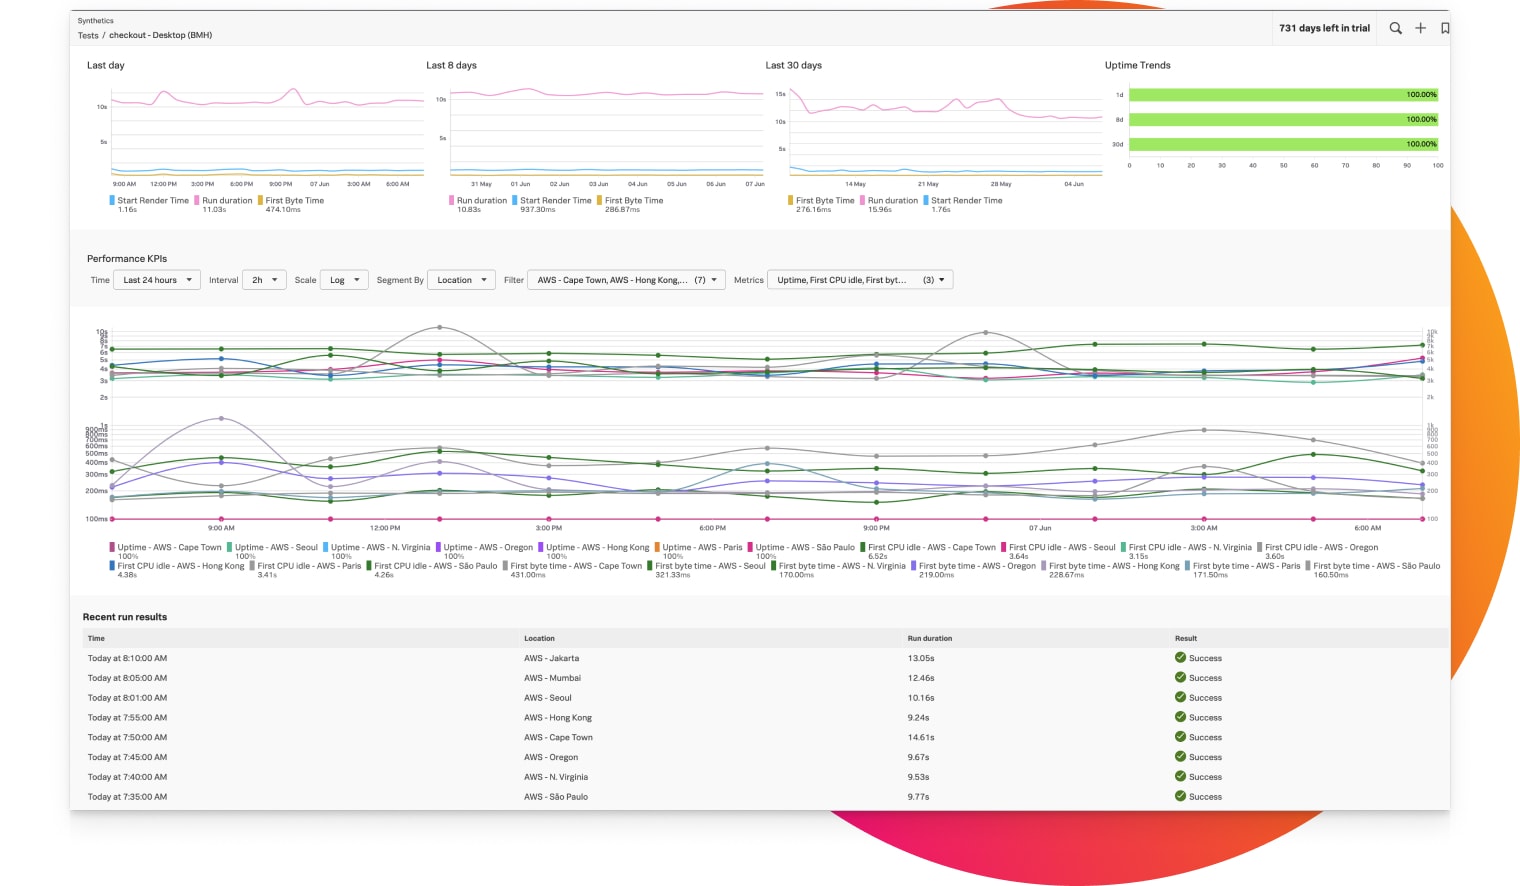
Get a complete picture of the user experience

Use synthetic tests for a clear view of what your end users see, then layer in real user data with OpenTelemetry-based instrumentation and 40+ metrics that describe the user experience. 

We’re all attuned to the potential business impact of downtime, so we’re grateful that Splunk Observability helps us be proactive about reliability and resilience with end-to-end visibility into our environment.

Jose Felipe Lopez, Engineering Manager, Rappi
protect

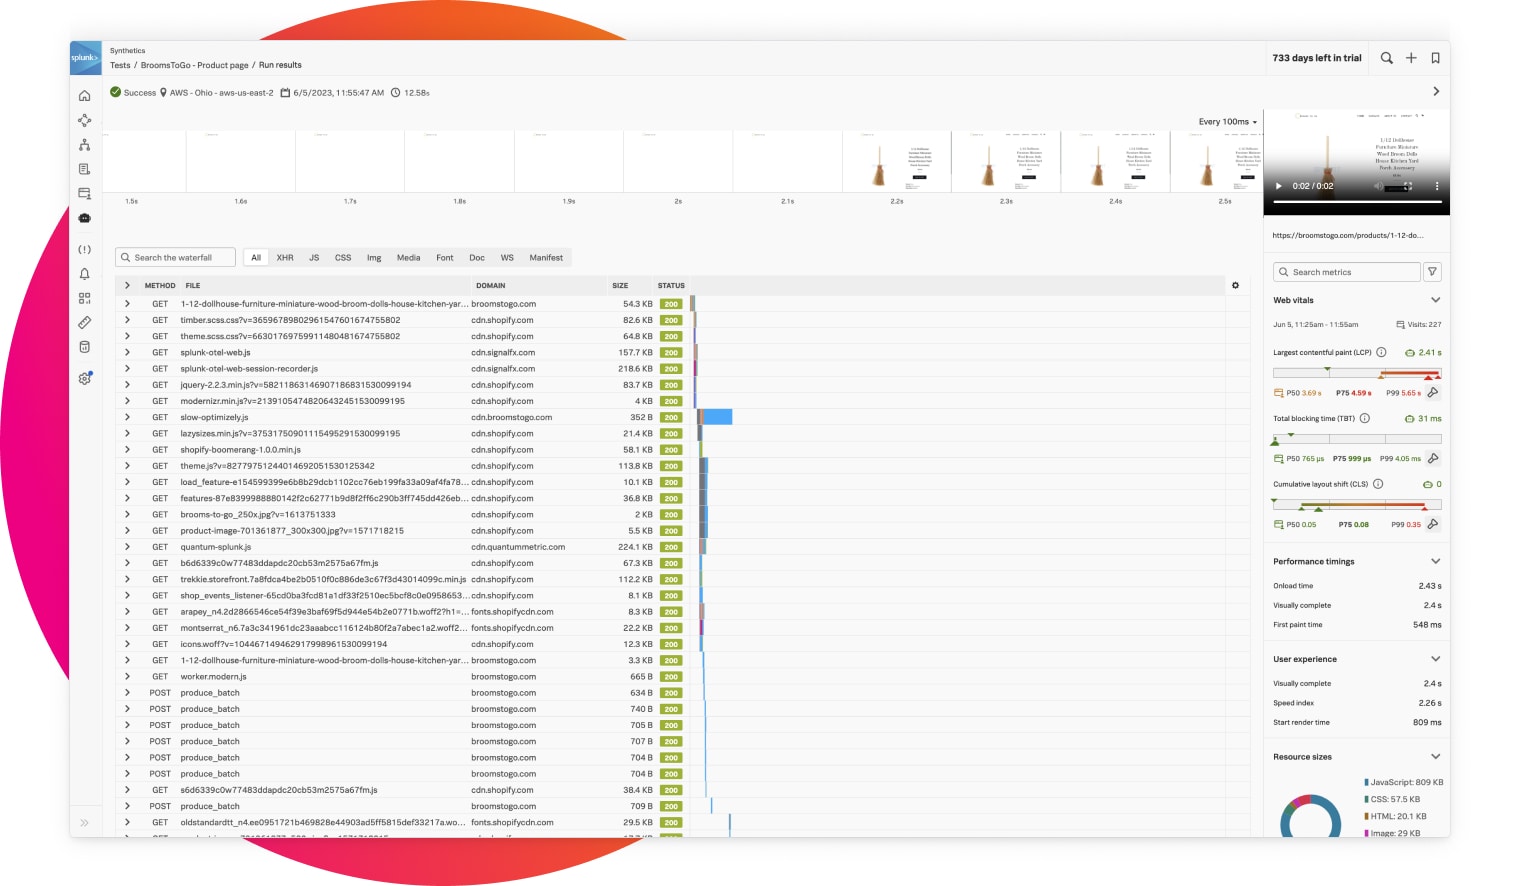
Investigate any issue

Splunk connects all front-end transactions with their back-end traces, giving you full visibility into how this and third-party applications impact the user experience. Video recordings of the customer sessions help clearly diagnose the issue. 

Splunk’s Filmstrips help our business and marketing users understand exactly how new features or content impacts performance. Teams see exactly how the page loads both before and after adding a new design feature to the site, which creates accountability with marketing and our third-party vendors.

Scott Jungling, Frontend Engineering Manager, Build.com
rba

Break down silos with shared understanding 

Access all the telemetry data you need to debug user-impacting issues, including simple, shareable dashboards that show related front-end metrics, back-end metrics, traces and logs all in one place.

From testing new features to identifying easy performance wins, Splunk Synthetic Monitoring helps embed performance across our development life cycle. We've decreased load time by 30% with Splunk Synthetic Monitoring helping eliminate customer-facing issues and optimize web performance.

Tom Wilson, Principal Engineer, Blue Apron

ProductS

Best-in-class digital experience monitoring

Get all the end-user context you need. Seamless connectivity to backend performance data improves web, mobile and application performance to deliver experiences that win customers — and drives revenue.

View All Products

RELATED USE CASES

More that you can do with Splunk

understand impact of changes understand impact of changes

Understand impact of changes

Easily identify the impact of planned and unplanned changes to your environment so you can address issues quickly.

View Use Case
observability-icon observability-icon

Enable self-service observability

Share best practices, collaborate effectively and minimize MTTR — all with built-in cost controls.

View Use Case
DevOps DevOps

Debug problems in microservices

Tap into standardized tooling to make debugging problems in microservices easier, faster and more cost-effective.

View Use Case

Learn more about digital experience monitoring

Digital experience monitoring, or DEM, is a top-down, customer-centric approach to monitoring that focuses on customer experience as a main signal for system health, rather than infrastructure or application availability.

Synthetic monitoring simulates end-user interactions with a service or site to help monitor the availability (uptime), functionality and performance of a web page, business transaction or user journey.

RUM provides information about the experience of real users, including: timing (performance) data on how a web page was rendered or delivered content, data on errors (typically JS errors), and dimensional data specific to the end-user (web browser, device type, geography, internet provider, etc.).

Get started

Create the optimal experience for your users.