none
The system of record and intelligence layer of the agentic enterprise
The Splunk Platform, which powers the Cisco Data Fabric, transforms raw machine data into organized insights, delivering unified visibility, intelligent data management, and AI-powered efficiencies to connect fragmented data and drive agentic operations.

Unify data and insights at scale
Break down silos across SecOps, ITOps, Engineering, and NetOps. Unify and correlate cross-domain insights with data management, federation, and turnkey storage.

Fuel intelligence with contextualized machine data
Transform enterprise-scale raw telemetry into trustworthy, contextualized data so your AI agents can operate accurately.

Activate trusted agentic operations at scale
Have the right data and tools to easily enable your AI assistants and agents to predict issues early and automate repeatable responses with safety and compliance guardrails.

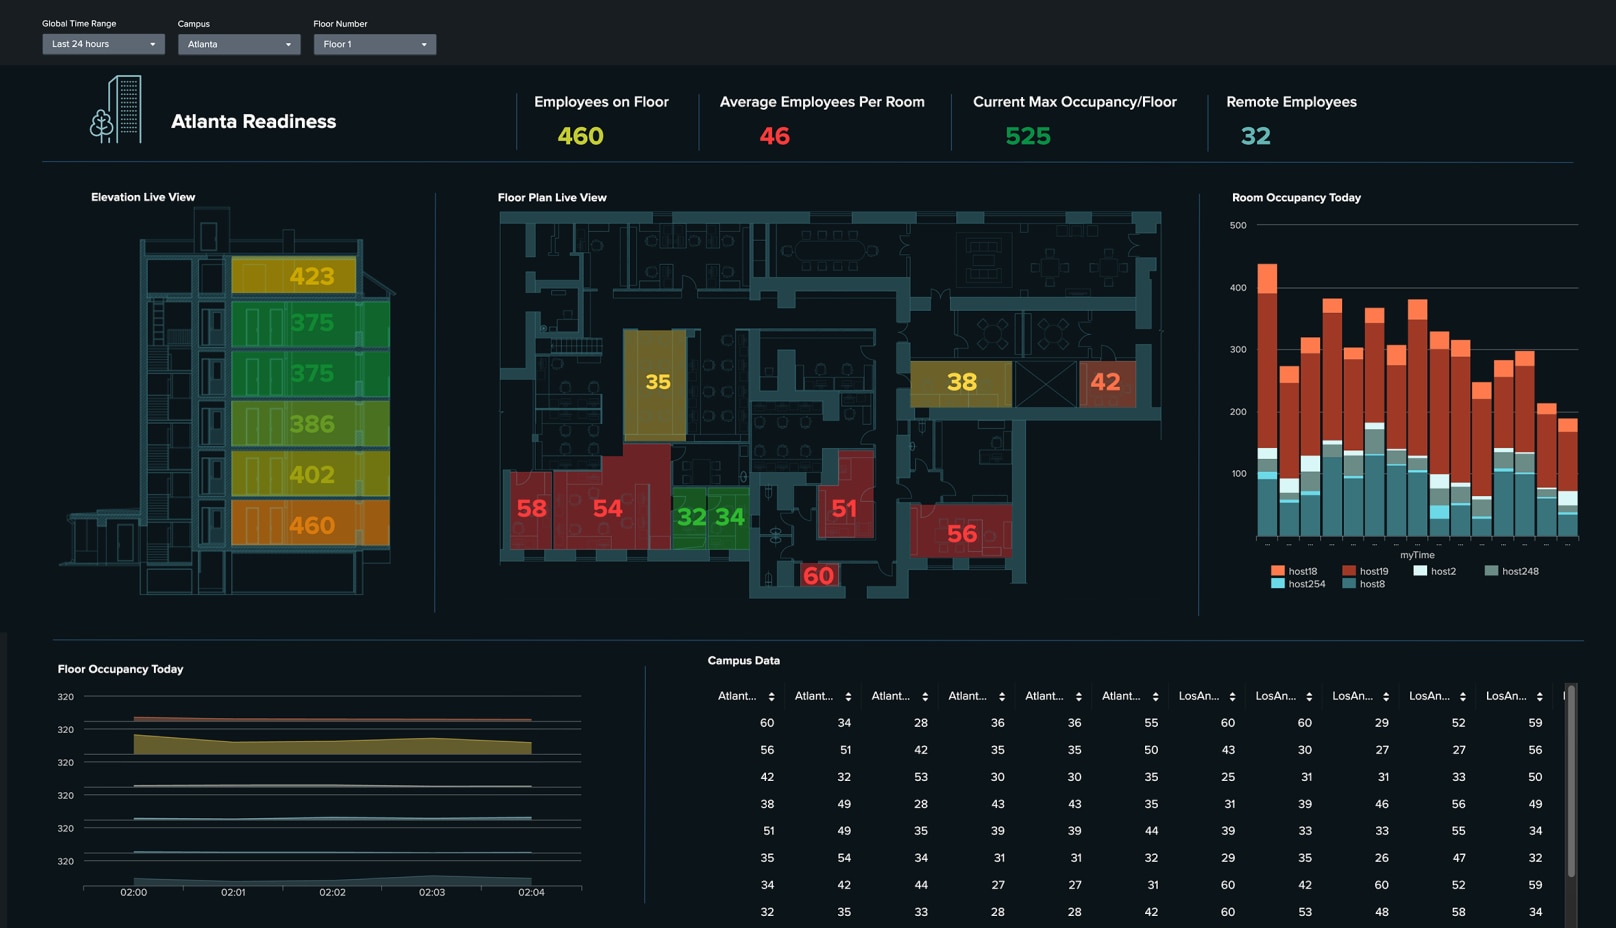
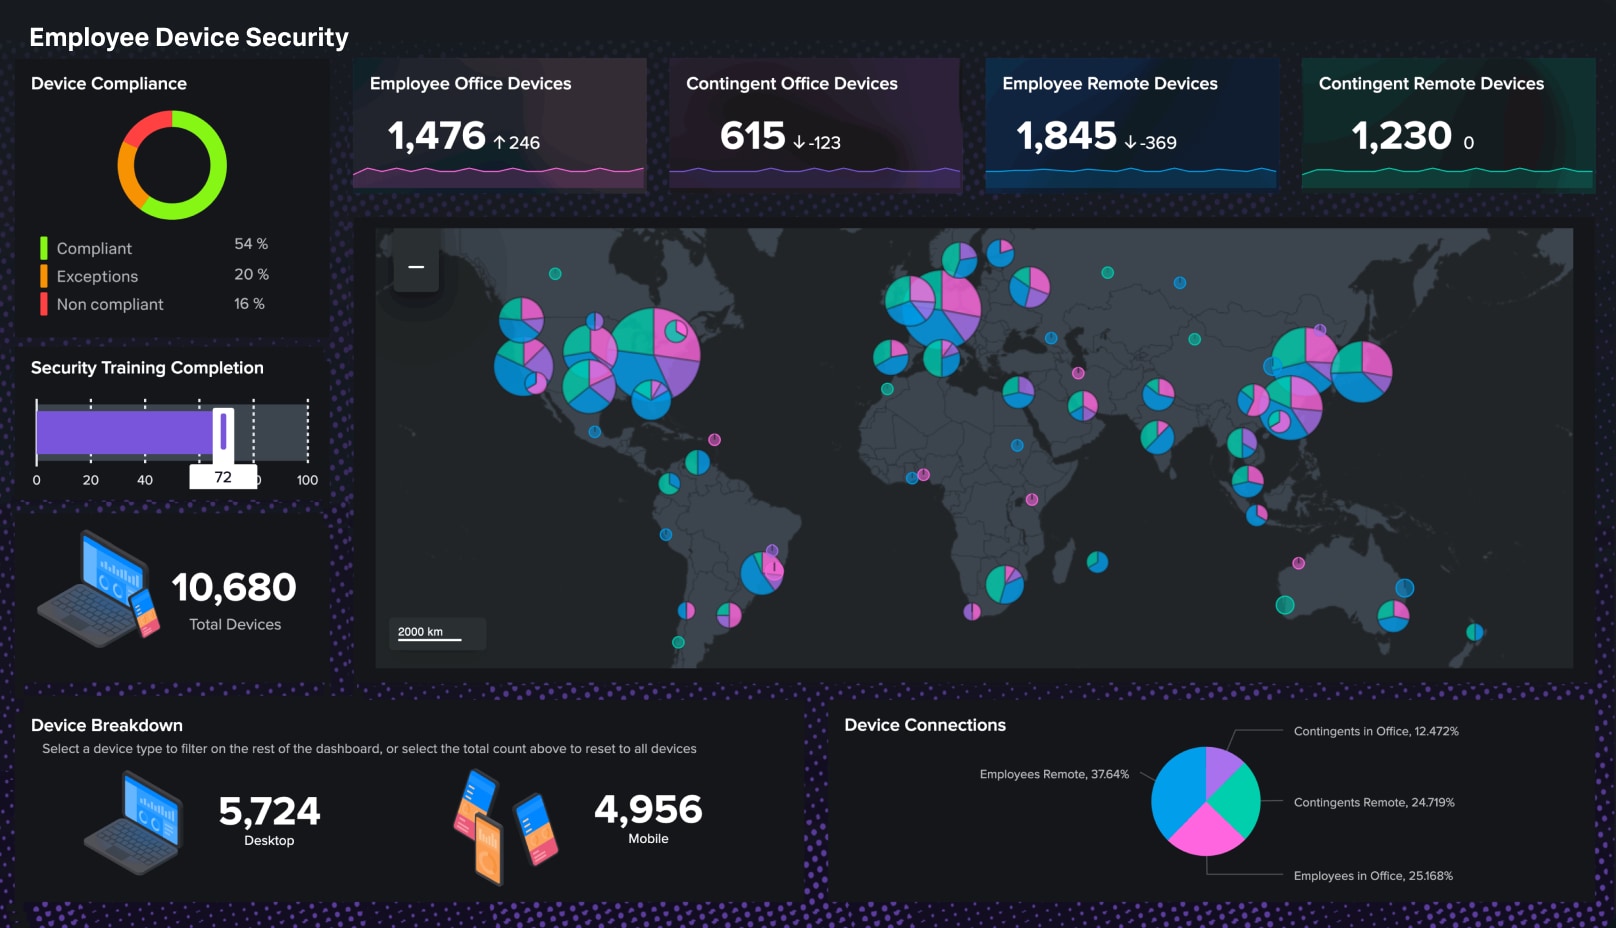
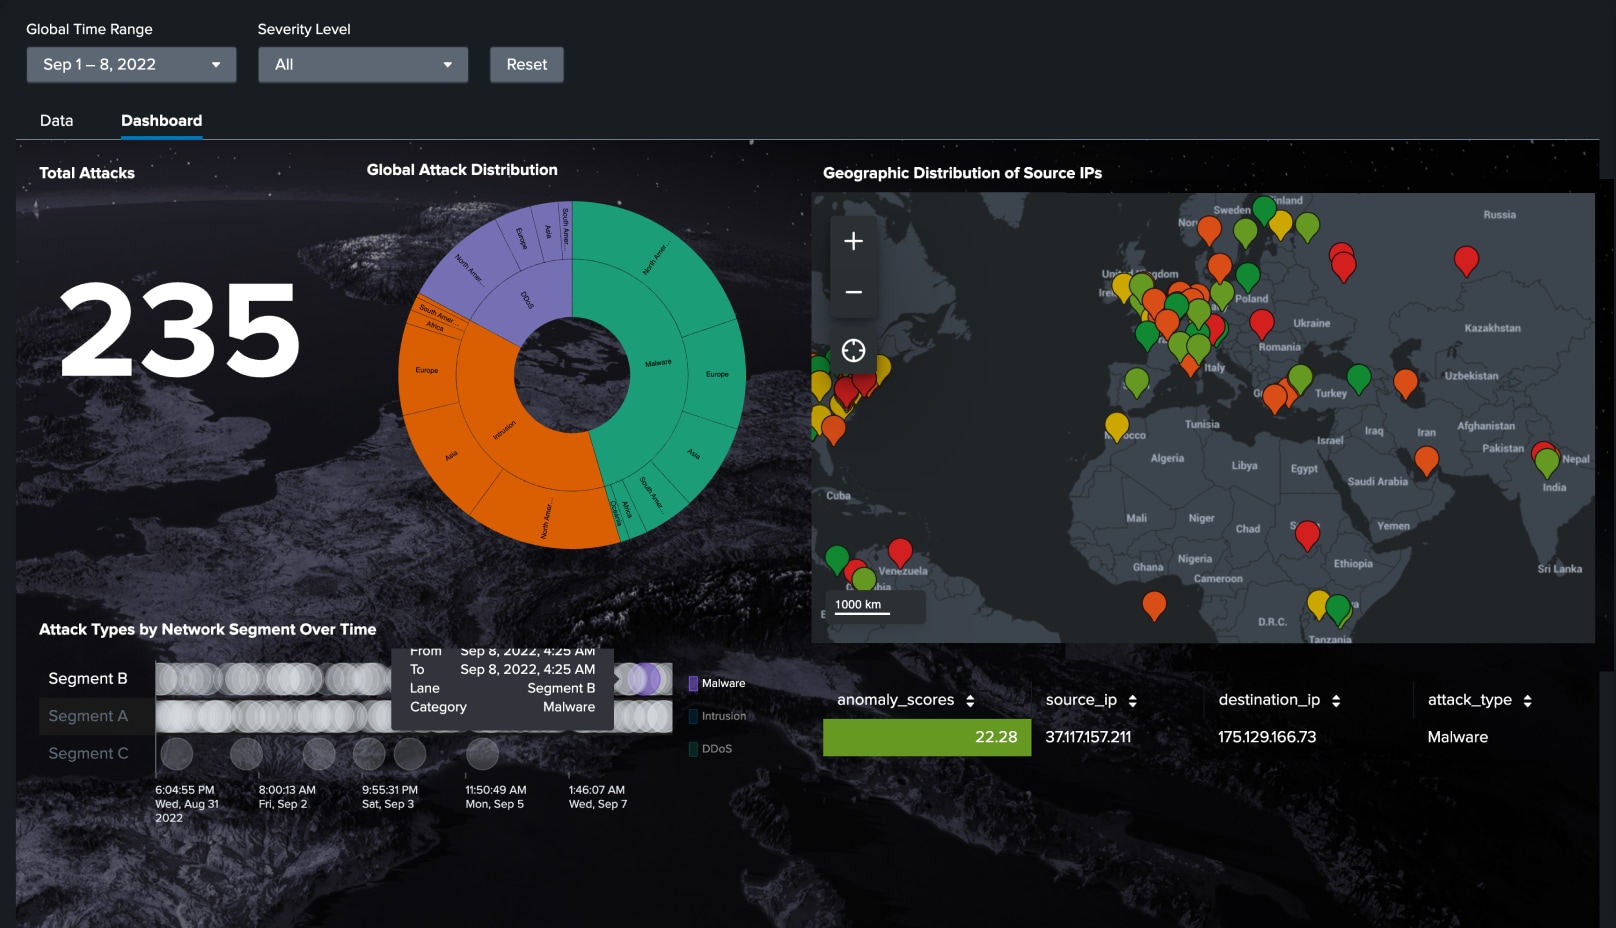
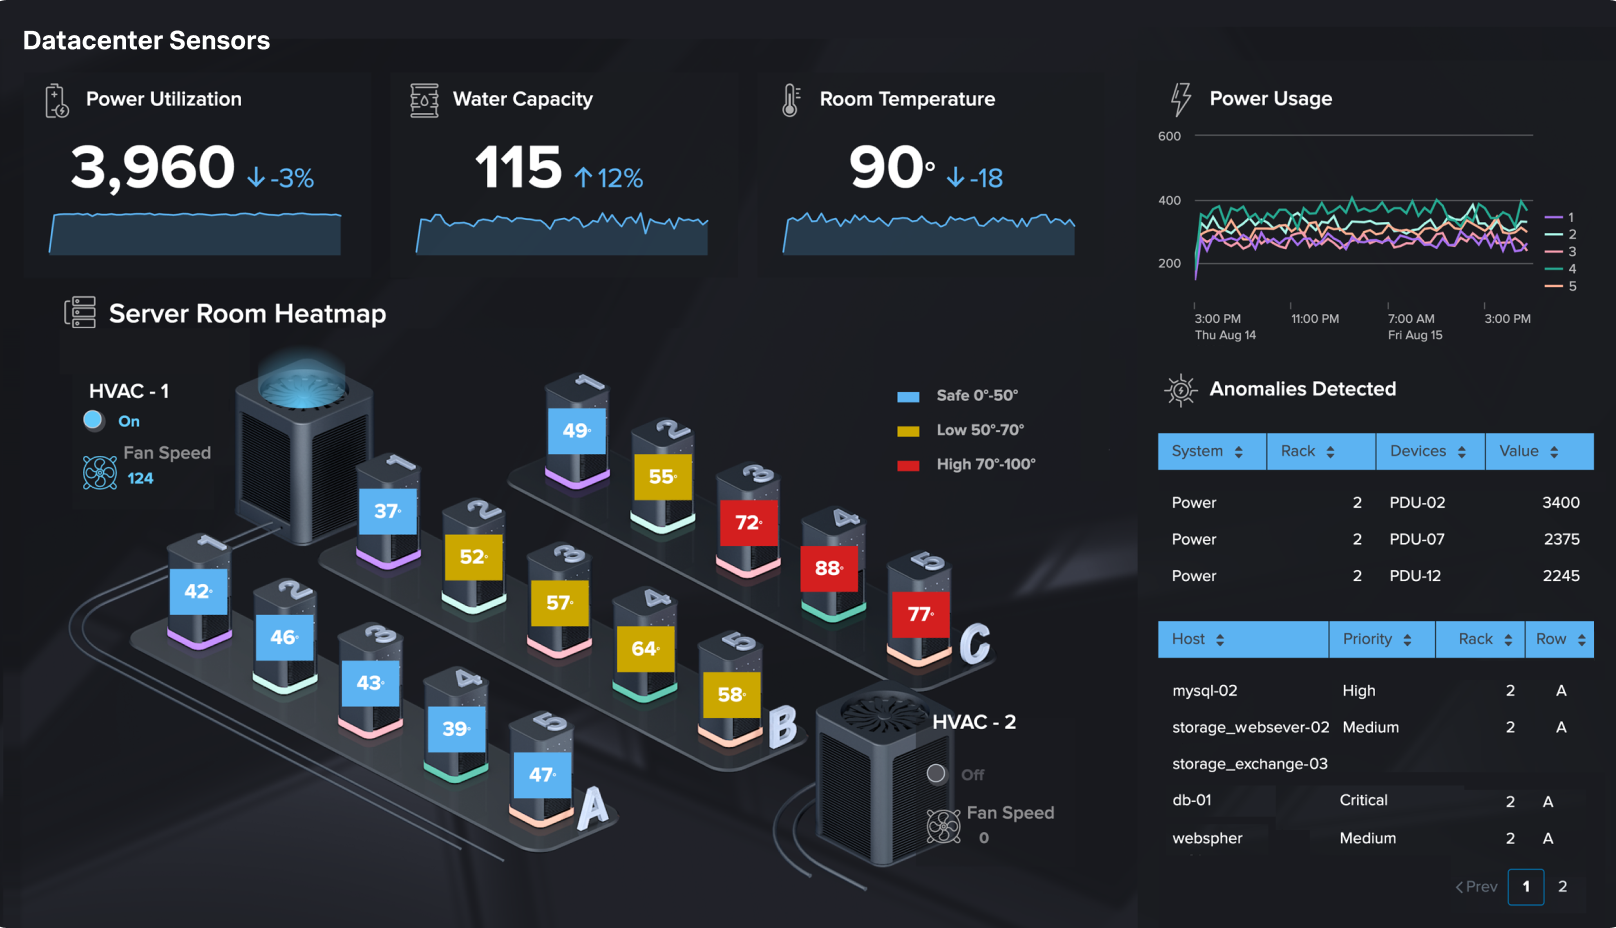
Your single control plane across domains
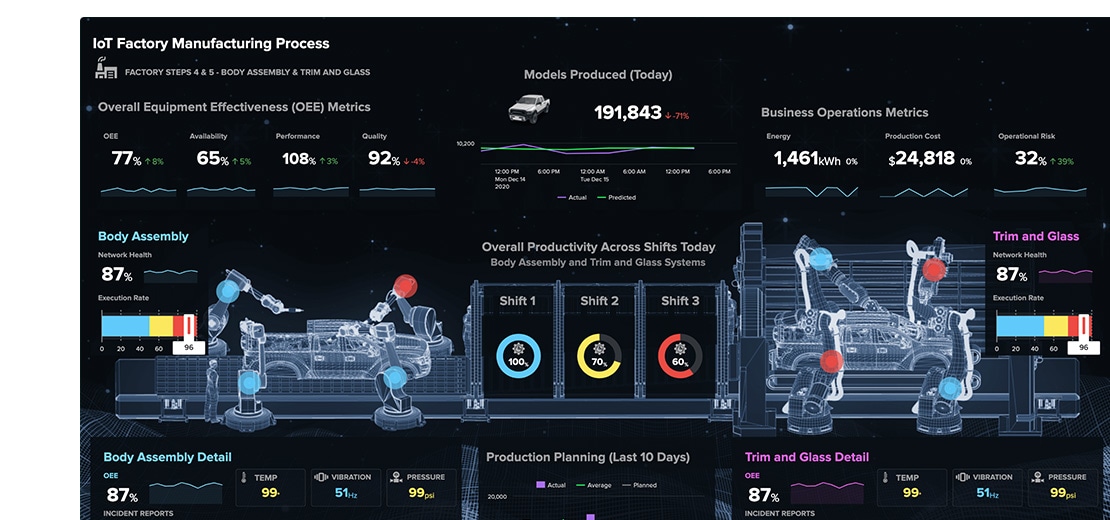
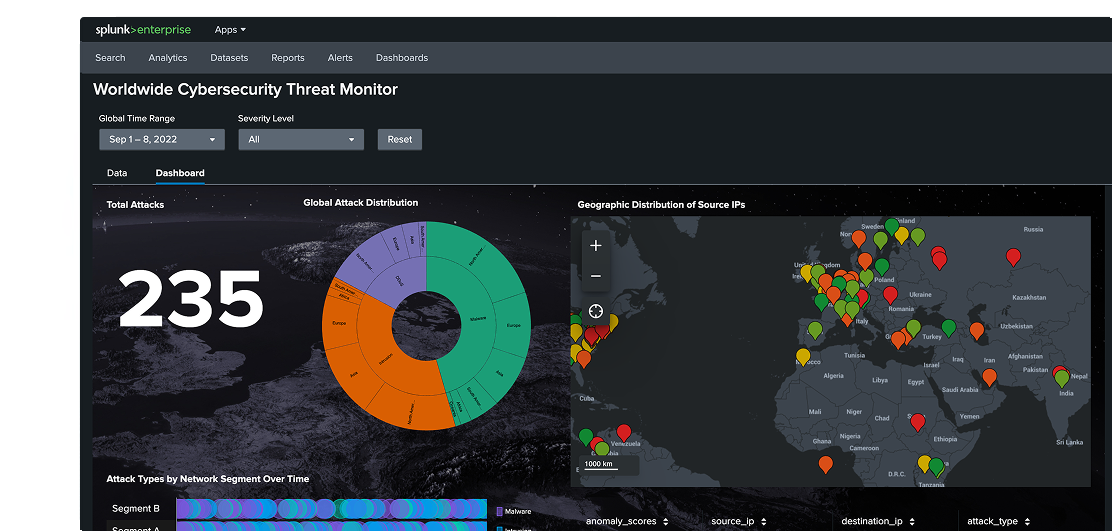
Turn complex, cross-domain raw data into real-time operational context at scale, so analysts and AI agents can work from a trusted view of system behavior, not isolated signals. And quickly create powerful visualizations with Dashboard Studio.


CUSTOMER STORY
Bosch builds a sustainable future with data-powered insights with Splunk
With Splunk’s real-time dashboards, we can make decisions faster and ensure production runs as smoothly as possible.

CUSTOMER STORY
Continental Revs up Security, Efficiency and Innovation with Splunk
The Splunk Platform helps us monitor performance for every machine and technology so we can pinpoint the root cause of an issue, fix problems faster and help people do their jobs better.

CUSTOMER STORY
FINRA Protects American Investors with Splunk Cloud and AWS
When we looked at what other companies were providing, they were playing catch-up to the capabilities that were already in Splunk.

CUSTOMER STORY
Regeneron Harnesses Science and Splunk to Develop Life-Changing Medicines
Our risk for downtime is reduced because we’re able to track and address issues preemptively.”
Interoperable and extendable ecosystem
The Splunk Platform integrates seamlessly with your existing technology, offering flexibility through 2,000+ integrations and a thriving ecosystem of experts.
Connect, customize, and innovate with Splunk
- Explore the full Splunk portfolio to unify security and observability across your enterprise.
- Extend your capabilities with thousands of integrations, community-built apps, and add-ons on Splunkbase.
- Drive innovation and influence product evolution by sharing feedback through the Voice of the Customer program and Splunk Ideas.
- Access a network of expert guidance on Splunk Community and Splunk Lantern for technical information and collaborative solutions.
Awards and Recognitions
The Splunk Platform powers leading security and observability solutions.
It's the platform driving Splunk Enterprise Security, recognized as a 11-time Leader in the Gartner® Magic Quadrant™ for SIEM, empowering thousands of customers to outpace adversaries. The Splunk Platform fuels our market-leading observability solutions, also a Gartner® Magic Quadrant™ Leader, enabling system reliability, optimized performance, and real-time insights across your entire digital ecosystem.
2025 Leader in Observability Platforms
An Eleven-Time Leader
#1 SIEM solution in all three Use Cases
Security Analytics Platform Leader
A Five-Year SIEM Leader
A worldwide SIEM for enterprise leader
Related categories
Unified security
Defend against threats with precision and speed. Splunk’s unified threat detection, investigation, and response provides complete visibility, AI and automation, threat intelligence, and high-fidelity alerts.
Agentic observability
Monitor and troubleshoot across any environment, stack, and network, including your AI infrastructure. Prevent and prioritize issues based on business impact.