Splunk Observability at .conf26: Optimize AI at Scale
Observability Dave HickmanKey takeaways
- Maximize infrastructure resilience - Splunk Observability helps you make your whole tech stack work for AI — see AI stack performance, isolate app vs. network issues fast, and rank problems by business impact.
- Monitor agent behavior and optimize tokenomics - Splunk gives you the ability to scale AI agents safely —evaluate agent quality, block hallucinations and unsafe actions at runtime, and attribute every token before it hits an invoice.
- Troubleshoot autonomously - Splunk Observability helps your teams detect, investigate and resolve incidents faster— with automatic instrumentation, AI that groups alerts, pinpoints root cause and guides remediation, and new editions for Splunk Observability Cloud and low-cost observability logs.
Observability used to just be about answering “what broke?” Now it’s evolved to also answering a new question: “can I trust the behavior of my AI agents?” Can you catch a hallucination before a customer does? And can you can you keep AI token costs in check? None of these replaces the classic observability questions and answers. Those are still as critical as ever. What's changed is that you now must answer both questions at once to find and prevent issues faster, with visibility running from app to infrastructure to business process to AI itself.
At .conf26, we’re announcing new Splunk Observability innovations designed for that shift: to help you Optimize AI at Scale by maximizing infrastructure resilience, monitoring agent behavior, optimizing tokenomics and troubleshooting autonomously.
These announcements build on Splunk’s role as the intelligence layer for trusted agentic operations across the enterprise. That means moving from “is my application running?” to “are my agents behaving correctly? And at a reasonable cost?” Clear those roadblocks and scaling agentic AI stops being a leap of faith.
Splunk Observability is helping close that gap with these innovations across four connected areas:
Start with the layer everything else sits on.
Maximize Infrastructure Resilience
Make the entire tech stack work for AI
- Track real-time health of critical business processes and connect technical performance to business outcomes with Business Journeys in Observability Cloud.
- See instantly if problems are in app code or network paths with ThousandEyes Network Insights in Observability Cloud.
- Turn network signals into cross-domain insight with the Network Intelligence app, accelerating detection, troubleshooting, and resolution.
- Get cost effective log analytics with Log Essentials for Observability Cloud to debug app and infra problems with logs in context.
Monitor Agent Behavior
Evaluate and govern agent behavior
- Build trust in AI by evaluating, observing, and controlling agent behavior and costs with Agent Observability.
Optimize Tokenomics
Manage token consumption and usage to control costs and measure adoption and ROI
- Connect agent cost, adoption, and productivity to business value with Tokenomics in Agent Observability
Troubleshoot Autonomously
Fix problems faster — and build apps that are easier to fix
- AI SRE helps teams automate detection, alert correlation, and troubleshooting and have partnered with Anthropic to deliver code-level remediation through Splunk Observability Studio and Claude Managed Agents..
- Automatically instrument AI-generated code from day one with Observability Studio, so every app reaches production without blind spots, security exploits or tech debt
- Accelerate onboarding and investigation with ITSI 5.0's redesigned experience and Event iQ's AI-driven alert grouping and diagnosis
- Jumpstart your Observability journey with Free Edition for Observability Cloud and explore at your own pace
Here’s what’s new across Splunk Observability at .conf 26.
Maximize Infrastructure Resilience
Connect Golden Signals to Business Outcomes with Business Journeys
Business Journeys in Observability Cloud — Available September 2026.
As enterprises scale AI workloads and complex distributed architectures, tracking golden signals alone is no longer enough. To resolve incidents faster and with greater precision, ITOps, engineering teams and AI agents need deeper business context—understanding not just which service is failing, but how that failure impacts business processes and service health. Whether customer onboardings are silently stalling, loan applications are delayed in underwriting, or retail orders are missing delivery SLAs, traditional service dashboards miss these multi-system workflows.
Business Journeys bridges this gap by correlating frontend user sessions (RUM) and backend microservices (APM) with business identifiers. Automatically discovered from your existing OpenTelemetry instrumentation, Business Journeys gives humans and AI SREs the real-time context needed to eliminate war-room guesswork and prioritize remediation based on measurable business impact.
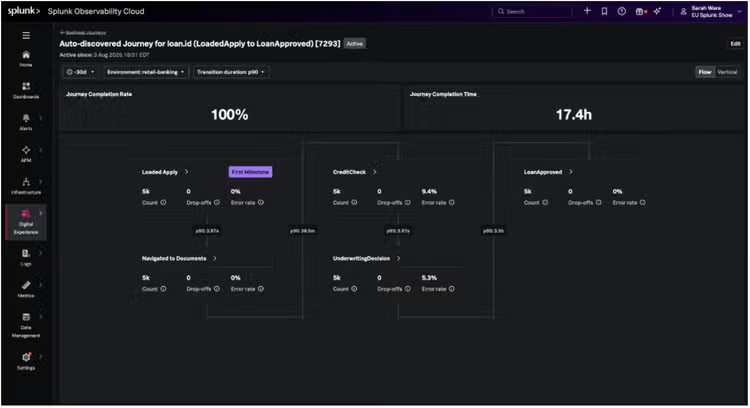
Learn more with Stop Guessing What Matters: Move Beyond Golden Signals to Curated Business Journeys.
App or network? The same test answers both
Network visibility in Splunk Synthetic Monitoring — available October 2026.
Every war room starts the same way: app team says their services are healthy, network team says their paths are clean, and the bridge call runs another forty minutes while users keep suffering. Siloed telemetry is what keeps that standoff going — and MTTR pays for it.
Now you can create and manage application and network synthetic tests in one place, with visibility from 1,000+ vantage points worldwide. Application and network signals come from the same test run, so the failure domain is settled by shared evidence instead of argument. From there, drill into related app telemetry in Observability Cloud or pivot straight into ThousandEyes network diagnostics.
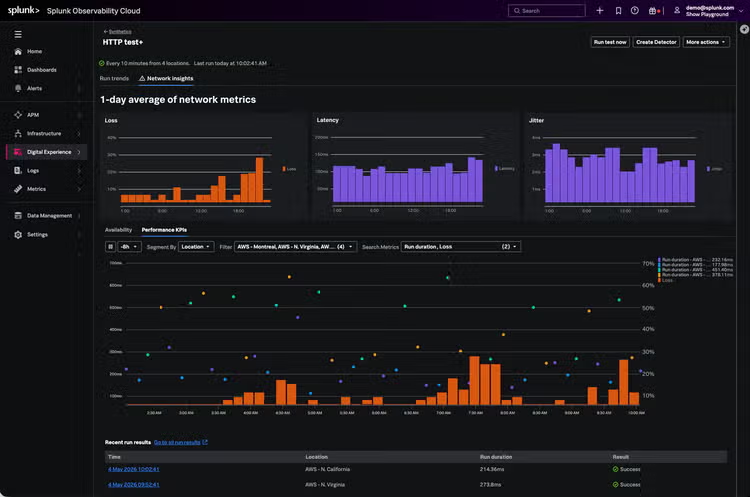
Learn more with Announcing the Network Intelligence App and New Network Visibility in Splunk Synthetic Monitoring
You have the data. Now you have the network.
Network Intelligence App — Available September 30, 2026.
Most enterprises are already sending network data to Splunk. Network Intelligence turns it into a live picture of the network: Cisco device topology, health, and events, with an event taking you straight to the affected device and the interfaces, links, and site around it. Topology comes from your Cisco controllers, so it reflects the network as it is right now rather than a diagram from last year. Nothing new to deploy, and no additional charge for Splunk customers.
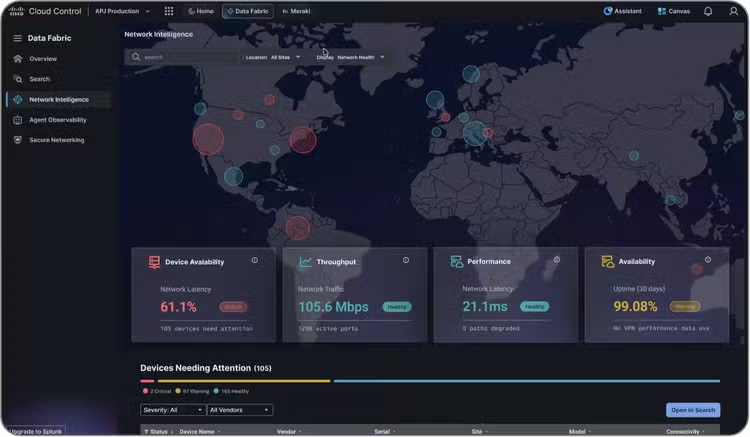
Learn more with Announcing the Network Intelligence App and New Network Visibility in Splunk Synthetic Monitoring
Observe Agent Behavior
Agents run around the clock. Someone still has to check the work.
Splunk Agent Observability — available September 2026 on-premises and in Cisco Cloud Control and Observability Cloud, powered by Galileo.
Teams are shipping agents. However, they are struggling to roll them out at scale. Unlike traditional software, agents are unpredictable and non-deterministic in nature. They also lack the governance and guardrails needed to build trust and ensure they are performing as intended at the right cost.
This is why we acquired Galileo. Galileo, now Splunk Agent Observability, evaluates agent, output, and RAG quality using high-accuracy evals — out-of-the-box evaluators plus custom ones you define, at a fraction of the cost of relying on frontier models for LLM-as-judge. Instead, teams can observe 100% of traffic without the need for sampling, giving teams visibility into the root cause of errors inside complex multi-agent workflows. Additionally, fine-tuned Luna small language models (SLMs) provide low latency and reduced costs for evaluations, helping enforce runtime guardrails to block issues like hallucinations.
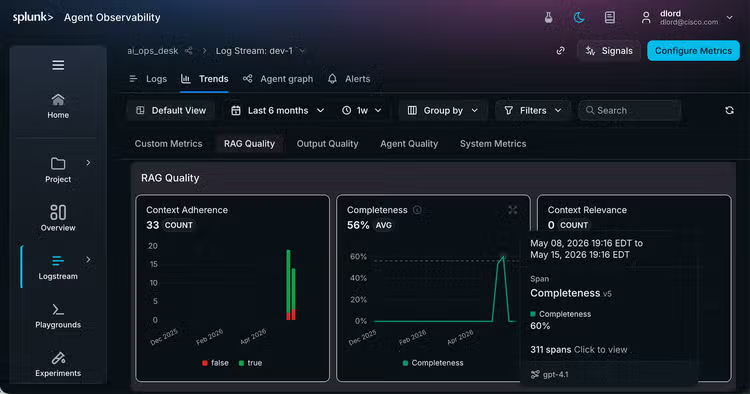
Learn more about observing, evaluating, and guardrailing your AI agents with Splunk Agent Observability.
Optimize Tokenomics
More cost visibility, less surprise bills at the end of the month
Tokenomics — Available September 2026 in Splunk Agent Observability
You know that sinking feeling when a monthly bill arrives with a number you can't account for? That's where a lot of engineering organizations fall short as they continue to adopt AI coding agents like Claude Code and Codex.
Tokenomics provides visibility into coding agent cost, adoption, and productivity in one view. Finance and engineering leaders can investigate and attribute cost spikes by users, teams, models, or tool providers to optimize usage and spend, and soon connect these insights to business value. They will be able to forecast consumption patterns to project where spend is headed before a billing period ends, using the Cisco Deep Time Series Model (CDTSM). Teams can set budgets, get anomaly insight to drive accountability, and drive tool efficiency.
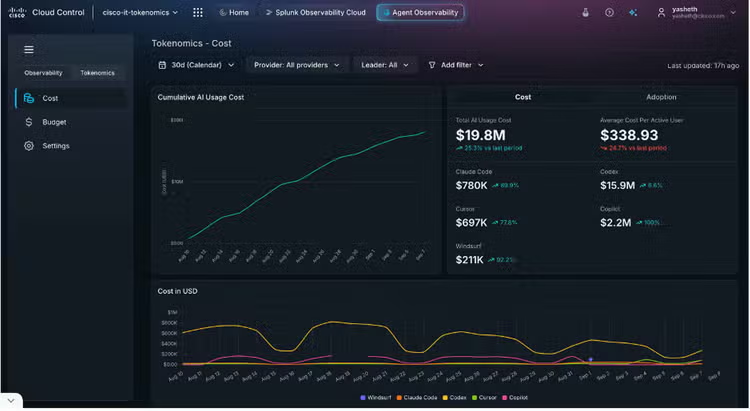
Learn more about attributing coding agent usage, spend, and adoption with Tokenomics.
Troubleshoot Autonomously
Fewer alerts, faster remediation through Splunk Observability Studio and Anthropic’s Claude Managed Agents (CMA)
AI SRE in Observability Cloud — Available now.
Engineering teams still spend too much time navigating dashboard sprawl, alert storms, and constant context switching obscures which signals share a single root cause. The result is prolonged downtime and tired people.
AI SRE acts as your new agentic teammate to help reduce complexity and toil. Intelligent alerting groups and consolidates alerts into unified, actionable incidents. The AI troubleshooting agent analyzes MELT data to pinpoint where a complex issue potentially started. Then teams can execute guided remediation plans or leverage Anthropic's Claude Managed Agents (CMA) to execute code-level fixes in secure sandboxes, keeping engineers in full control and building trust.
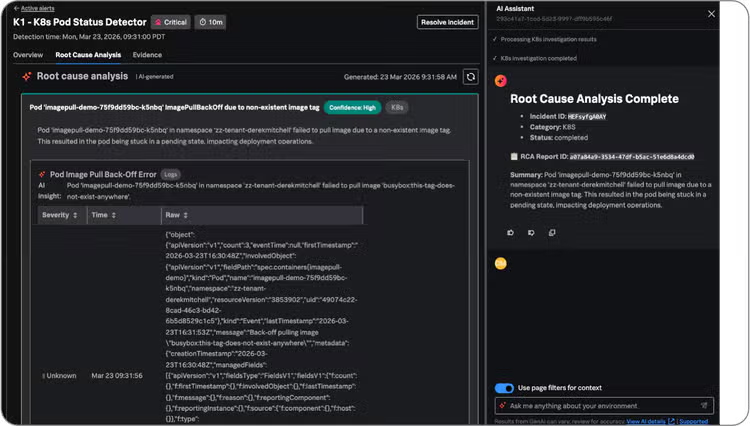
Learn more here.
Observability that starts before the first code deploy
Observability Studio — Available Now
AI-generated code reaches production fast, potentially creating unknows and lack of visibility for the people running it. Apps are built before anyone has figured out how to monitor, debug, or operate them, and that debt compounds.
Observability Studio is a developer-first experience for instrumenting apps with OpenTelemetry from the start — including apps built with AI coding agents like Claude Code and Codex, instrumented directly from inside those interfaces. Guided workflows, less configuration guesswork, instrumentation in minutes instead of hours — no need to become an OTel expert first. The shift is from "monitor what you already built" to "build software that's born observable."
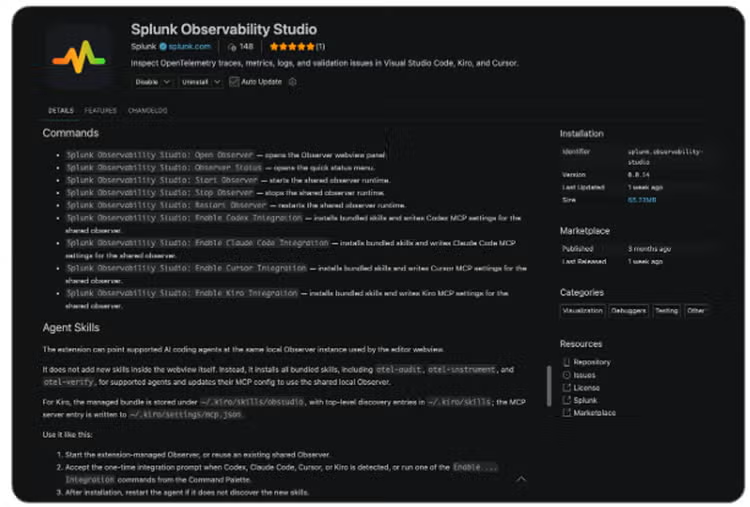
Learn more with Born Observable: Why AI-Generated Apps and Agents Need Visibility from Day One.
Alert noise, meet a model that learns from your analysts
ITSI 5.0 + Event iQ — Generally available Now
Event iQ Detect in Splunk IT Service Intelligence already used machine learning to pick the right fields for correlation. Now it learns from your team. When a responder splits an episode that grouped unrelated alerts, or merges two that were always one incident, that feedback flows back into the model at retraining. Grouping accuracy improves with use — no manual tuning marathon.
Event iQ Diagnose writes it down for you: a plain-language summary of an active or resolved episode, with likely root cause and recommended next steps. Handy for a Level 1 analyst at midnight. Also handy for the exec who wants a straight answer.
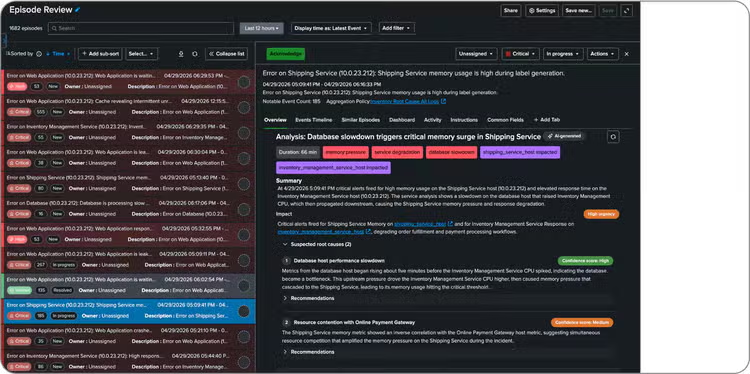
Learn more with Introducing Splunk IT Service Intelligence 5.0
Kick the tires and ditch the time-bound trials
Free Edition for Observability Cloud — Available June 1, 2026.
Enterprise-grade observability for free for up to 15 hosts, and it doesn't expire. No credit card, no procurement cycle, no sales conversation. Bring your own telemetry or start poking around the pre-populated Playground — dashboards, APM traces, infrastructure, alerts, and AI-powered insights are already flowing. Agent observability is included, so you can trace agent interactions, model calls, tool usage, latency, and errors and actually understand why an agent did what it did. All features are included, which means what you build here carries straight into production.
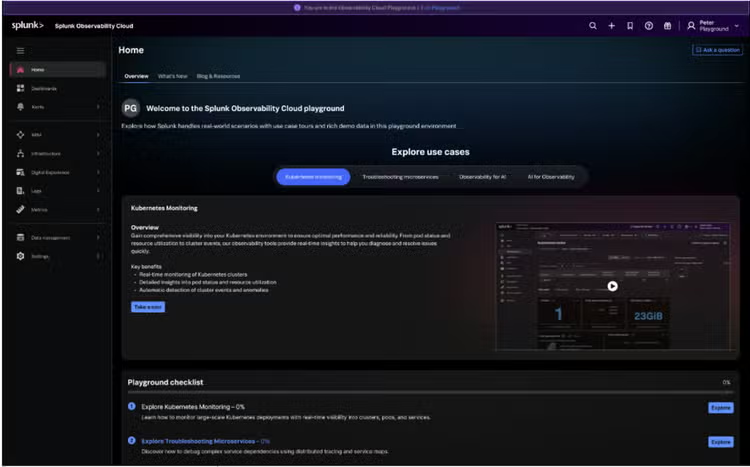
Learn more with Deep Insights, No Barriers: Splunk Observability Cloud Free Edition
Observability that changes shape as your stack does
Observability Essentials and Observability Premier — November 2026.
Simplified editions for Observability Cloud – Essentials and Premier – simplify how customers buy and expand observability across their business, with cost effective log analytics to debug application and infrastructure problems.
The observability landscape is changing, and Agent Observability has quickly become a critical capability. Given how quickly teams are building new applications and writing new code, it's critical we make it simpler and more cost effective to adopt observability.
The Essentials Edition of Observability Cloud will focus on core observability use cases designed for teams getting started with Agent Observability, APM, and Infrastructure Monitoring.
The Premier Edition is for teams building agents at scale and needing additional capabilities like Digital Experience Monitoring, runtime application security, and DB monitoring. Since this is all built on the Splunk Platform and logs play such a foundational role for app and infrastructure debugging, we are embedding cost-effective observability logs directly into these editions.
Low-cost Observability Logs are generally available today; Essentials and Premier editions are coming in November.
Learn more about Splunk Observability Cloud Essentials and Premier Packages.
Conclusion
Observability is evolving. The latest Splunk Observability innovations bring that future closer: Agent Observability and Tokenomics to evaluate agent behavior and manage token consumption and usage, Network Intelligence and ThousandEyes Network Insights to settle the app-versus-network standoff; Business Journeys to connect technical signals to business impact, and AI that helps instrument, detect, investigate, summarize, and recommend to prevent, surface and remediate business impact. Less noise. Faster answers. Better digital experiences.
Get Observability Cloud for free - or book a demo - to see how Splunk can help you move faster, troubleshoot smarter, and accelerate your journey to trusted agentic operations.
Many of the products and features described herein remain in varying stages of development and will be offered on a when-and-if-available basis. The delivery timeline of these products and features is subject to change at the sole discretion of Cisco, and Cisco will have no liability for delay in the delivery or failure to deliver any of the products or features set forth in this document.
Related Articles

Macro ATT&CK for a TTP Snack
Heading to Black Hat? Splunk’s Countdown Is On