Observe, Evaluate, and Guardrail Your AI Agents With Agent Observability
Observability Dayna LordEarlier this year, Cisco completed its acquisition of Galileo, a company focused on evaluation, observability, and real-time guardrail capabilities for multi-agent systems across the agent development lifecycle. This technology is designed to help address one of the biggest challenges enterprises face as they put AI agents into production: closing the AI trust gap.
Today, we’re taking the next step with Agent Observability. We’re helping teams evaluate agent behavior, observe performance, optimize costs, and block harmful actions on premises, or now in Splunk Observability Cloud and through Cisco Cloud Control. With this unified approach and visibility, teams gain greater reliability, control, and confidence over their agents, models, and underlying infrastructure – ensuring they are performing as intended at the right cost.
Closing the AI Trust Gap
Agents introduce challenges traditional observability wasn’t designed to solve. Agents reason, plan, call tools, interact with enterprise data, and take multi-step actions on our behalf. Because they’re non-deterministic, the same input doesn’t necessarily produce the same output — or even follow the same path.
An agent can hallucinate, diverge from intent, or act without accurate context. A single interaction can consume thousands of tokens. Harmful outputs can undermine customer trust and business outcomes.
That combination of autonomy, unpredictability, cost, and risk is what creates the AI trust gap. This gap introduces an entirely new set of questions for organizations that deploy agents into production: Did the agent give the right answer? Why did it take that action? Is it hallucinating? Is it exposing sensitive information? How much did the interaction cost? And ultimately, can we trust it?
Traditional observability alone wasn't designed to answer these questions. Agent Observability is designed for this new reality.
Evaluate Agent Quality and Availability Without Frontier-Model Cost and Latency
Because agent behavior changes as models, prompts, tools, data, and user behavior change, determining agent quality requires robust evaluation, including finetuning and measurement. LLM-as-a-judge approaches provide a scalable way to measure agent quality. However, using large frontier models across high volumes of production traffic can lead to significant cost and latency. The result is often a tradeoff between evaluating enough interactions to catch problems and keeping evaluation affordable.
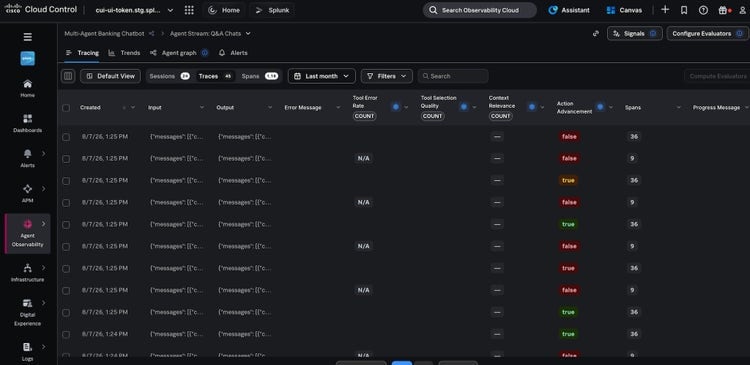
With Agent Observability, teams don’t have to make the tradeoff and decide what “quality” means. They will soon be able to use Luna small language models (SLMs) to continuously perform high-accuracy, low-latency, cost-effective evaluations at scale. As a result, 100% of traffic will be graded without the high cost and latency associated with relying exclusively on frontier-model judges. Additionally, subject matter experts can provide feedback to continually refine the evaluation quality, creating a loop where human expertise improves automated evaluation, and automated evaluation makes that expertise and finding the unknowns scalable.
Additionally, teams can leverage powerful out-of-the-box evaluators for RAG, agentic performance, response and multimodal quality, and other specific measures of quality. Teams can also create custom LLM-as-a-judge evaluators to judge the quality of responses.
Observe Agents From Prompt to Production
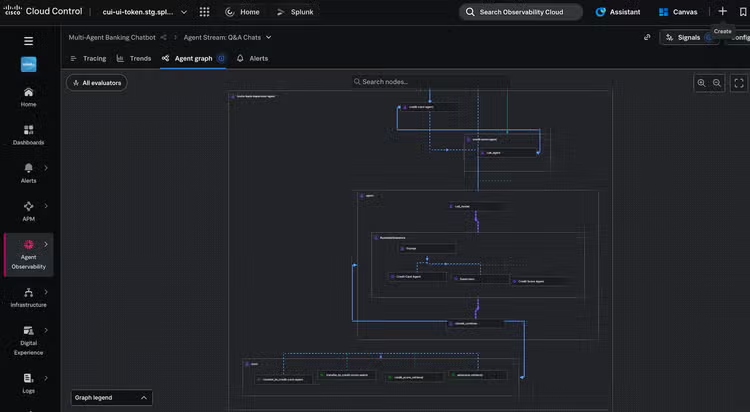
When something goes wrong with an agent, finding the root cause isn't always straightforward. A single request can trigger orchestration logic, model calls, and retrieval from vector databases, tool calls, and interactions between multiple agents. A failure anywhere in that chain can affect the final output.
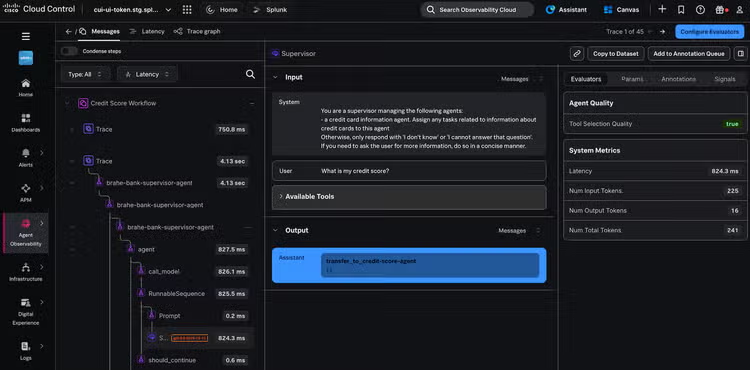
Agent Observability provides visibility into how agents behave, helping teams visualize agents, tool calls, and handoffs alongside quality, cost, and performance metrics.
Teams can also instrument their applications across popular LLM providers and agent frameworks using the Agent Observability SDKs or API, with built-in support for distributed tracing and OpenTelemetry. This flexibility gives teams the detailed traces they need to pinpoint problems, understand dependencies, and investigate failures and individual interactions across increasingly complex agent architectures.
The result is a more complete view of AI applications — one that connects agents, models, and supporting services rather than viewing each in insolation.
Understand the Tokenomics Behind Your AI
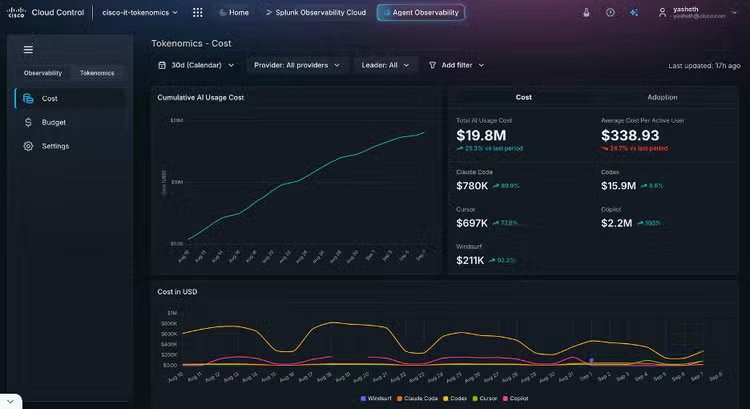
AI is expensive. This large cost is not only because of agent evaluation, new infrastructure components, or complex multi-agent workflows. It is also because of the rapid adoption of coding agents. Unfortunately, more consumption and higher spend doesn’t always lead to meaningful business value. Teams also struggle to account for surprise bills that appear.
Tokenomics provides finance and engineering leaders with one view to understand the users, coding agents, and models that are responsible for cost spikes. And whether that consumption is producing better outcomes.
Therefore, instead of simply asking “How much are we spending?”, teams can now ask more valuable questions: Which agents are driving consumption? Where are the resources being wasted? Are more expensive models actually producing better and cost-effective results?
This feature is available on premises, in Observability Cloud, and in Cisco Cloud Control later this month. Key integrations will include Claude Code, Codex, Cursor, Windsurf, and GitHub Copilot.
Check out the tokenomics blog or webpage to learn more.
Ensure Guardrailing Is Everyone’s Job
As agents gain more autonomy, access more sensitive data, and interact with more tools, they also expand the attack surface and increase the potential impact of failures. New threats like prompt injection, tool misuse, and other harmful actions are introduced. As a result, trust and safety can’t be the responsibility of a single team.
The engineers that troubleshoot failures, AI teams that improve models and agents, subject matter experts that define what good looks like, security teams that mitigate risks, and business leaders that quantify ROI and business value all play a role in defining what safe, accurate, and compliant agent behavior looks like.
Agent Observability helps turn those shared standards into action by enabling teams to transform evals into runtime guardrails that block harmful or inaccurate actions before they reach users. Centralized controls also help enforce safety and compliance policies consistently across agents without hard-coding that logic into every individual application.
One Approach Across On-Premises, Splunk Observability Cloud, and Cisco Cloud Control
Enterprises aren't building AI in one place. Their agents, models, data, applications, and infrastructure span cloud, on-premises, and increasingly distributed environments. That's why Agent Observability is designed for AI workloads no matter where they reside.
That's also why Agent Observability is accessible through Cisco Cloud Control – a unified platform for agentic operations with one login for every Cisco product. This vertically integrated, co-designed, full-stack experience spans silicon and optics, networking, compute, data, models, AI applications and agents, and security and observability across every layer. This visibility helps teams connect AI infrastructure health with agent and model behavior, security, reliability, and cost efficiency.
Get Started With Agent Observability
Check out our website and explore the documentation to learn more about how Agent Observability can help you move past the trust gap toward a future where AI agents are not just powerful, but trustworthy and secure. Get hands-on with the Splunk Observability Cloud Free Edition today.
Related Articles

Splunk Named a Leader in the 2024 IDC MarketScape for SIEM for Enterprise

Detecting Microsoft Exchange Vulnerabilities - 0 + 8 Days Later…