Announcing the Network Intelligence App and New Network Visibility in Splunk Synthetic Monitoring
Observability Courtney DragoonEverything You Own Is Green. So Why Is the Application Slow?
A user in Sydney reports that checkout is slow. APM looks healthy. Infrastructure looks healthy. The application is responding. Every dashboard you own is green, and every one of them is right.
The problem sits somewhere those dashboards were never watching.
Fewer of the systems in a transaction are yours every year. Authentication is Okta. Payments are Stripe. You see the call leave and the result come back, and nothing in between. Underneath all of it runs a layer you never got to instrument at all: name resolution happens on a resolver you don't run, and every one of those calls crosses ISP paths you'll never administer. When the failure lives out there, your instrumentation has nothing to say about it — not because you configured it badly, but because attribution stops at the edge of what you control.
The network you do own usually lives somewhere else entirely. Network teams work in devices, interfaces, and links, in their own set of tools. Application teams work in services and traces, in theirs. Two groups, two pictures, and a reconciliation exercise before anyone can act. Both teams have their data. What neither has is the other half — the devices you operate and the path you don't — showing up where they're already troubleshooting.
See the Network You Own — And the Ones You Don’t
Today we're extending network observability in Splunk with two capabilities that address both sides of that gap.
- Network visibility in Splunk Synthetic Monitoring - adds network and internet evidence to synthetic application tests, extending the investigation across delivery paths and dependencies you don't own or control.
- The Network Intelligence app - brings the enterprise network you operate into Splunk: devices, interfaces, topology, events, and the relationships between them.
One Test, Application and Network Evidence
Synthetic monitoring has always answered one important question well: did the application experience work? Synthetic Monitoring in Splunk Observability Cloud can now give you the network evidence that explains why it didn't.
Create an HTTP test the way you do today. It runs on a global agent network of more than 1,000 vantage points, with multiple ISPs in the same city, so you can tell whether a problem hits one provider or everyone. Add agents inside your own environment for coverage from behind your firewall. Both the application results and the network measurements now come from the same test execution.
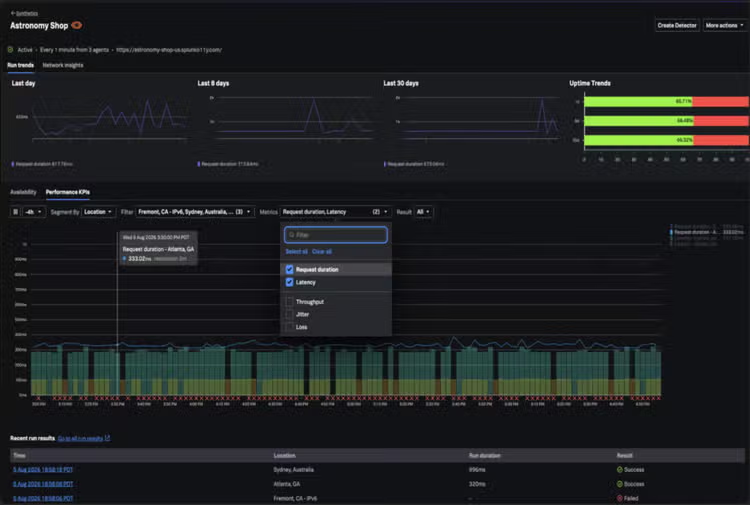
Response time sits alongside latency, packet loss, and jitter for the same runs. Instead of building an OpenTelemetry pipeline to ingest a separate network stream and then aligning two datasets after the fact, you start with application and network evidence that came from the same test.
If response time rises while latency or loss increases, you know where to look. If network conditions stay healthy while the transaction slows, your application teams can stop looking there and move on.
And when the evidence does point at the network, you don't have to stop at the edge of your own environment. Move from the synthetic result straight into path visualization for that exact test at that exact time period — hop by hop, which ISP, which resolver, which cloud path. That reaches the dependencies your application instrumentation can't: internet paths, ISP infrastructure, DNS, and the cloud networks between your service and your users. Evidence about infrastructure you depend on and will never administer.
Your network team opens the same test in ThousandEyes and sees the same results, so both teams work from one set of evidence instead of two independent versions of the incident. You can also create detectors on supported network test signals — uptime, run duration, DNS resolution — from the workflow you already use for every other detector.
Network metrics land in a no-charge metric category in Splunk, so you aren't billed twice for data you already own.
Available October 21, starting with HTTP tests, with additional test types to follow.
Understand the Network You Operate
The other half of the problem sits inside the enterprise network itself. Application teams see a service dependency; network teams see devices, interfaces, links, sites, and topology. The new Network Intelligence app brings that operational model into Splunk instead of asking network teams to translate their environment into an application-centric abstraction.
Topology from your controllers, not from a diagram. The app pulls topology straight from the Cisco controllers you already run — Meraki, Catalyst Center, SD-WAN Manager — so it shows the physical and logical relationships in your environment as they stand today, not a drawing that went stale months ago. And it models the network the way networks actually behave – as a graph of relationships, not a single hierarchy.
Event to device to topology, in one workflow. An event fires, you land on the affected device, and the interfaces, links, and site around it are right there — instead of hopping between a polling tool, a controller console, and a map to assemble the story by hand.
No blank canvas. The app discovers, classifies, and monitors your devices by default, with out-of-box profiles for supported Cisco platform families, so you skip the configuration project that usually comes before anyone sees a monitored device.
Nothing new to buy, nothing new to deploy. The Network Intelligence app is free for Splunk customers and runs on Cisco network data most of you already send us. No new collection stack, no multi-month deployment ahead of first value.
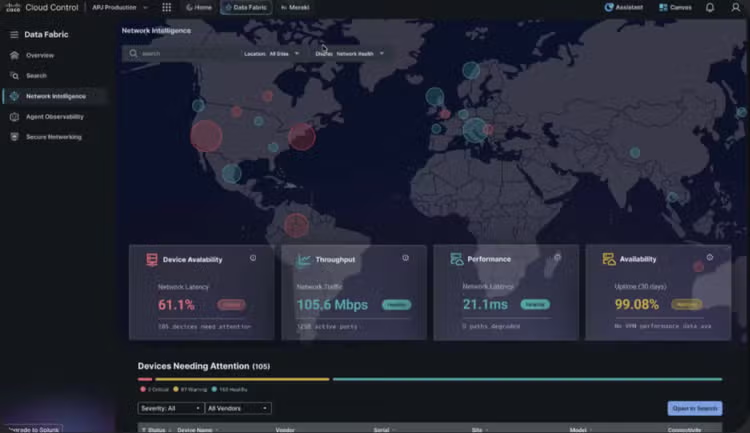
Network Intelligence App in Cisco Cloud Control
Because that topology and event context lives in Splunk, it isn't a separate destination. Your network data joins broader correlation and full-stack troubleshooting rather than sitting in another tool to check — which is the larger shift behind both of today's announcements. Observability has always been strongest inside the systems teams instrument directly, but digital experience doesn't stop there. It depends on enterprise networks, cloud providers, DNS, ISPs, and internet paths that matter just as much to performance.
You get a more complete path from symptom to evidence: start with the user or synthetic experience, determine whether application or network conditions are contributing, follow the path when the problem sits beyond your environment, and investigate the enterprise network when the fault domain comes back inside it. Because when a digital experience fails, knowing that something is wrong isn't enough. You need to know where to look, what evidence explains it, and who can act.
Available September 30, starting with Cisco device topology, with third-party support to follow.
Get Started
- Network visibility in Splunk Synthetic Monitoring — available October 21 for customers with Splunk Observability Cloud and ThousandEyes. Setup is a one-time OAuth link between the two products; existing RBAC in both is honored.
- Network Intelligence app — available September 30.
*Cisco-on-Cisco case study; reflects Cisco IT's broader observability strategy rather than these capabilities in isolation.
Cisco IT reduced Mean Time to Detect and Resolve by 45% year over year running its own operations this way.
* And in a Forrester Total Economic Impact™ study commissioned by Cisco, a composite organization identified disruptive incidents 60% faster with ThousandEyes.
Related Articles
Detecting dynamic DNS domains in Splunk
Fueling the SOC of the Future with Built-in Threat Research and Detections in Splunk Enterprise Security