Making Observability Easier to Adopt and Scale: Introducing Splunk Observability Cloud Essentials and Premier Packages
Observability Courtney GannonThe questions teams bring to observability have changed. A year ago, the focus was services, latency and error budgets. Now teams are also evaluating agent behavior, measuring quality and managing token spend, often across the same applications and from the same engineering teams. Agentic operations have added new demands to the work teams already do.
Observability Cloud is evolving with those needs. Planned for early November, two packaged options — Observability Essentials and Observability Premier — simplify how customers buy and expand observability across their business while reducing commercial barriers to adopting agent observability.
Two Pricing Editions for Different Observability Needs
Observability Essentials brings together the capabilities teams need to monitor their applications and infrastructure, including APM, Infrastructure Monitoring, AI SRE, Observability Logs, and an entry point to Agent Observability. It gives teams a practical way to understand what is happening across their environment and begin evaluating how their agents perform.
When teams need more capacity or are managing more complex environments, Observability Premier builds on Essentials. It includes higher entitlements across the core capabilities, especially logs, along with deeper Agent Observability and access to cost-effective Luna evaluation. Premier also adds capabilities such as Digital Experience Monitoring, Database Monitoring and application security. Detailed entitlements and pricing will be available when the new editions launch in early November.
The two editions give customers a simpler way to choose the right level of observability for their business. Teams can start with the capabilities they need today and expand as their applications, workloads and agentic use cases grow.
Observability Logs is included in both editions, with different levels of log capacity to match your needs as your environment grows. Teams can retain and search application and infrastructure logs alongside metrics and traces, giving them the context they need to investigate issues as they adopt agentic applications.
Splunk Enables Cost-Effective Scaling for Log Observability Today
As applications scale, log volumes can grow rapidly. Retaining all of that data at the same level of search performance can increase the overall cost of an observability practice.
Observability Logs gives engineering and ITOps teams a more cost-effective approach, with list pricing of $0.60 per GB per day for 15 days of retention and $0.85 per GB per day for 30 days of retention. With this model, Splunk is taking a strategic step to make observability more affordable and scalable as data volumes grow.
Recent logs are readily available for day-to-day troubleshooting, while older logs can be retained in a lower-cost storage tier and made searchable when an investigation requires historical context.
By matching log storage and indexing to how teams actually use their data, organizations can retain the context they need while lowering the total cost of ownership of observability.
That makes it easier to expand observability across more applications, teams and environments without being forced to choose between visibility and cost. That makes it easier to expand observability across more applications, teams and environments without being forced to choose between visibility and cost.
Get More Value From Every Signal
Making logs more affordable is only part of the equation. Their value increases when teams can use them in context with the rest of their telemetry.
Splunk Observability Cloud brings together logs, metrics and traces so teams can follow an investigation across signals rather than treating each one as a separate workflow.
Metrics surface a change in application or infrastructure health. Traces show where a request is slowing down or failing. Logs provide detailed events needed to understand why.
Bringing those signals together – in a cost-effective way – helps teams move from detection to investigation with more context and spend less time piecing together what happened across disconnected tools.
Investigate Logs Where You Observe Your Applications
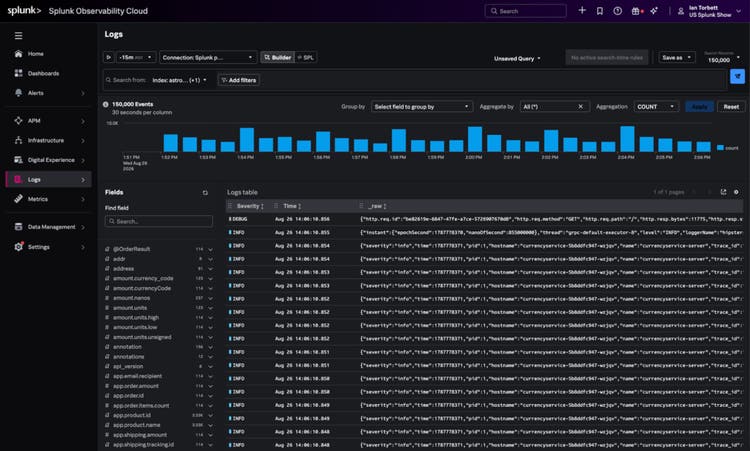
With Observability Logs, teams can explore and investigate logs directly within Splunk Observability Cloud.
Log Explorer provides a dedicated workspace for log investigations, with point-and-click exploration, natural language and SPL query experiences. Teams can move from infrastructure and service views into relevant logs, refine an investigation and turn what they discover into reusable operational context.
Log data can also be incorporated into dashboards and alerts, helping teams use logs not only for ad hoc troubleshooting but as part of their ongoing observability practice.
Keep Historical Context Within Reach
Some of the most difficult incidents require teams to look further back.
With Observability Logs, organizations can retain older log data in the lower-cost storage tier rather than keeping all logs in the same storage tier indefinitely. When an investigation requires that historical data, authorized users can bring it back into their investigation for search and analysis.
This approach gives teams access to deeper historical context when they need it while providing a more efficient way to manage growing log volumes over time.
Make Observability Accessible to More Teams
Observability shouldn’t require organizations to choose between comprehensive visibility and sustainable costs.
With a lower-cost storage tier for logs and an experience that connects logs with metrics and traces, Observability Logs gives organizations a more accessible way to build a complete observability practice.
Teams get the telemetry context they need to understand their applications and troubleshoot issues effectively. Organizations get a more cost-effective approach to retaining the growing volumes of data those applications produce.
Together, the new editions and Observability Logs give organizations a clearer way to build observability around what they need today and expand over time. For more information about Observability Logs, check out our docs.
Have questions? Join me and other Splunk Observability experts every Monday at 8:30 a.m. PT for Observability Cloud Office Hours. Not an Observability Cloud customer? Try it for free. Get your Free Edition of Splunk Observability Cloud now. Not a time limited trial. No credit card required.
Related Articles
Advanced Link Analysis, Part 3 - Visualizing Trillion Events, One Insight at a Time

CI/CD Detection Engineering: Dockerizing for Scale, Part 4