Born Observable: Why AI-Generated Apps and Agents Need Visibility from Day One
Observability Courtney GannonKey takeaways
- AI coding tools let teams build software fast, but this speed creates risk if applications aren't designed with visibility and monitoring from the start.
- Observability Studio lets developers test and validate tracking data in real time during development, catching problems before they reach production.
- Tracking AI costs, agent decisions, and system performance together helps teams control spending, speed up fixes, and build more trustworthy AI systems.
AI-powered IDEs have fundamentally changed the development lifecycle, allowing teams to ship applications, integrations, and autonomous agents in hours rather than weeks. This shift offers immense competitive potential—but it introduces a critical risk: organizations are producing software faster than they can understand, secure, or govern it.
The solution isn’t to throttle innovation; it’s to ensure every application and agent is born observable. Observability Studio provides the foundation for this shift, moving visibility from an afterthought to a core architectural requirement.
Software Creation is No Longer the Bottleneck
AI coding assistants have democratized rapid deployment. However, agents add a new layer of complexity by reasoning across multi-step processes—retrieving data, selecting tools, and making autonomous decisions. A single user interaction may now trigger a complex chain of model calls, database queries, and API requests.
The question is no longer "Can we build it?" but rather:
- Behavioral Clarity: Can we trace the logic behind an agent’s decision?
- Proactive Reliability: Can we detect failures before the end user does?
- Economic Accountability: Can we measure the cost, latency, and business value of every request?
- Governance at Scale: Can we verify compliance with security policies in real-time?
If these questions are addressed only after deployment, observability becomes a costly, reactive retrofit—and critical context is often lost in the process.
What it Means to be "Born Observable"
An application is "born observable" when visibility is baked into its design. From its first execution, it must emit structured telemetry that captures the full lifecycle of an interaction:
- User Journeys: Requests, transactions, and end-to-end sessions.
- Technical Telemetry: Logs, metrics, and distributed traces.
- AI Context: Model responses, token consumption, latency, and retrieval context.
- Agent Logic: Tool calls, decision paths, and fallback triggers.
- Governance Metadata: Deployment versions, ownership, and policy compliance status.
Traditional infrastructure monitoring is insufficient here. An agent might return an HTTP 200 status while producing an incorrect, unsafe, or prohibitively expensive result. True visibility requires correlating technical health with behavioral quality. By leveraging open standards like OpenTelemetry, this data becomes portable, consistent, and ready for analysis.
Introducing Observability Studio
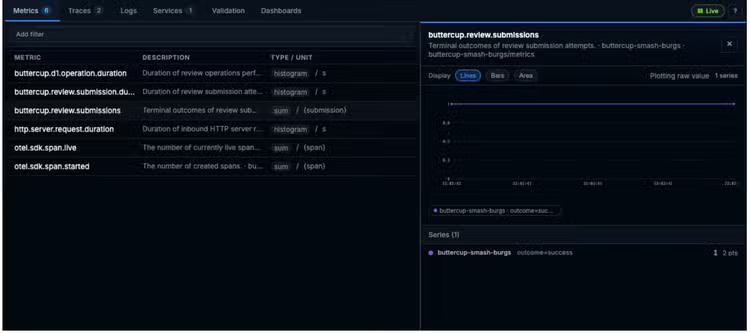
For developers and Site Reliability Engineers (SREs) who are tasked with building resilient systems, Observability Studio is an open-source instrumentation sandbox that provides a visual, real-time environment for designing, testing, and validating OpenTelemetry data. Unlike traditional observability backends that only provide feedback post-ingestion, Observability Studio enables teams to verify telemetry accuracy during the development cycle, resulting in faster instrumentation velocity, higher data quality, and improved operational resilience across the enterprise.
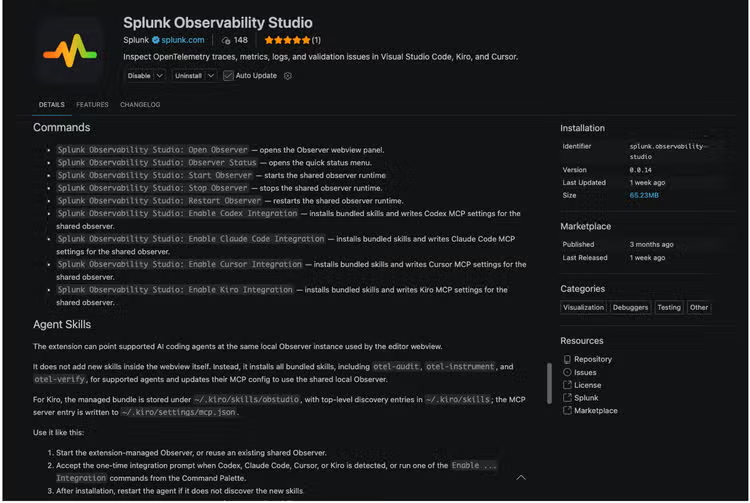
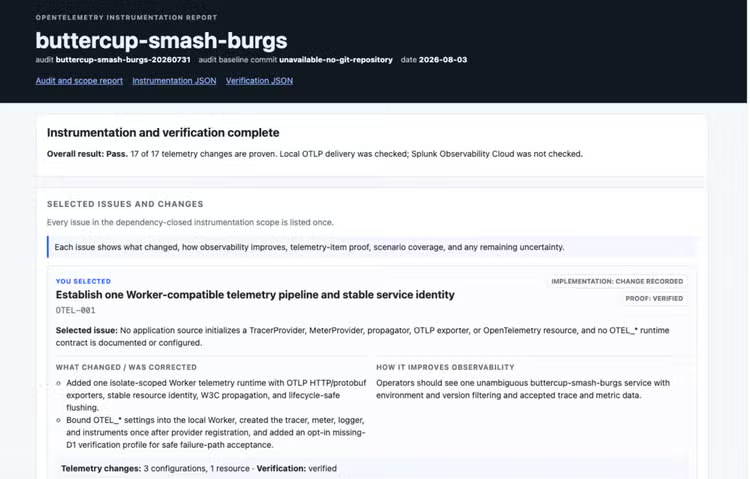
- Validate Software Sooner: Developers can move directly from generated code to evidence of how it behaves. By visualizing traces, dependencies, and resource consumption, teams can expose bottlenecks—like inefficient prompt loops or unreliable tool calls—before they reach production.
- Reduce Mean Time to Resolution (MTTR): Consistent context and end-to-end correlation eliminate the "needle in a haystack" search. Observability Studio maps incidents back to the specific agent step, model invocation, or dependency, drastically shortening the path from symptom to root cause.
- Scale Governance as a "Paved Road": AI-assisted development moves faster than manual governance. Observability Studio integrates into IDE workflows, embedding standard instrumentation and metadata into templates and scaffolds. Governance becomes a seamless part of the development process rather than a manual roadblock.
- Control AI Costs and Quality: Agent costs are dynamic. Observability Studio connects token usage and infrastructure consumption to specific features and user outcomes. This allows teams to identify redundant calls or expensive model choices, balancing cost-efficiency with performance quality.
Creating a Continuous Improvement Loop
Observability should do more than explain failures; it should drive the next iteration. Production traces reveal weak prompts, missing knowledge, and edge cases. These insights can be transformed into test cases and evaluation datasets, creating a robust feedback loop:
Generate → Observe → Evaluate → Improve → Deploy
Observability is a Now a Product Feature
For AI-generated systems, observability is not just an operations task—it is a requirement for quality, safety, and trust. Customers demand reliable outcomes, developers need fast feedback loops, and business leaders need proof of ROI.
The organizations that win in the AI era will not be those that generate the most code, but those that can best understand, improve, and trust what they build.
Try It Now
Regardless of your preferred IDE or the observability backend, Observability Studio empowers you to build "born observable" applications with complete confidence. By decoupling instrumentation validation from your specific infrastructure, you gain the freedom to innovate without platform constraints. Once your telemetry is perfected, you can seamlessly export it to your existing ecosystem. If you have not yet settled on a backend, sign up for a free edition of Splunk Observability Cloud to begin turning your high-fidelity, standardized data into actionable business insights .
Related Articles
Fashionably Late: The Zero Trust Trend is Here to Stay
Fortify Digital Resilience with Splunk + Cisco Talos Incident Response