Why You Need Observability With the Splunk Platform
Splunk’s extensible and scalable data platform has been instrumental in helping ITOps teams fully understand their tech environments and tackle any IT use case with data streaming, dashboarding, federated search, AI/ML, and more.
But, with the explosion of telemetry and the growing complexity of digital systems, ITOps practitioners who rely solely on a logging solution are missing out on critical insights from their digital systems. Without an end-to-end view into their environments, IT teams are not able to monitor confidently across their stack and troubleshoot issues quickly, putting at risk digital customer experiences and their business.
This can be solved with Splunk. On top of the industry-leading logging solution in Splunk platform, ITOps professionals can easily add Splunk Observability Cloud, our full-stack and OpenTelemetry-native observability SaaS offering for faster and further digital systems investigation. Splunk Observability Cloud allows you to bring in infrastructure, application, and end-user experience monitoring alongside the petabyte-scale data platform for a more flexible and comprehensive experience. Now you get the full picture of your events, in one same place.
See what bringing Splunk Observability Cloud to your Splunk platform can help you do.
Consolidate Tools for an End-To-End View of Your Data and Optimized Budget
Connect Two World-Class Products With Integrative Features
A common challenge for ITOps professionals and engineers is having to deal with too many solutions during their workflows, which often leads to data inconsistency, team silos, high monitoring costs, and long war rooms.
With Splunk offerings, you can centralize your logs, real-time metrics, traces, and event data management and reporting under one roof.
While the Splunk platform provides the logging you know and love, Splunk Observability Cloud brings in critical real-time metrics, infrastructure, and application data as well as real-user monitoring and synthetic testing for easier data analysis and reporting. Key cross-product features include Splunk Log Observer Connect to repurpose your Splunk platform logs in Splunk Observability Cloud, and Unified Identity to log into Splunk Observability Cloud using Splunk Cloud Platform credentials via SSO, extending the platform’s RBAC (role-based access control). It’s never been easier to connect both solutions, giving you comprehensive visibility of your stack and more control over your tool management, your budget, and your workflows.

Splunk Observability Cloud is powered by Splunk platform
Easily Jumpstart Your Observability Practice With OpenTelemetry
The Splunk Distribution of the OpenTelemetry Collector also makes it simple for Splunk platform customers to adopt Observability. Last summer, we introduced the Splunk Add-on for OpenTelemetry Collector (the “Add-On”) which simplifies metrics and traces data collection, configuration, and management for Splunk Enterprise or Splunk Cloud Platform customers who already ingest logs using Universal Forwarders and have processes for deploying TAs with tools like Splunk Deployment Server.
Now, you get a true 360 view of your data in one single place, making it easier to align across teams while also reducing tool sprawl and costs.
Find the Source of the Problem Faster
Whenever an outage comes up, ITOps and engineering teams are responsible for quickly identifying the source of the problem before it starts affecting business revenue or customer satisfaction. With Splunk, they can now easily pinpoint the root cause of an anomaly directly in Splunk Cloud Platform with a Splunk Observability Cloud capability called “Related Content”.
Related Content for Splunk Cloud Platform provides a preview of Splunk Observability Cloud’s real-time critical application services, infrastructure hosts - including Kubernetes - and trace context alongside events in the Splunk Cloud Platform’s Search and Reporting interface. Now, Splunk ITOps practitioners can easily visualize all their key data in one place for faster root-cause analysis and in-context troubleshooting of their mission-critical apps and infrastructure.
This capability also redirects ITOps teams to purpose-built solutions Splunk Infrastructure Monitoring and Splunk APM, so they can address the issue and resolve it swiftly in a no-code intuitive, and contextual interface.

Related Content for Splunk Platform lets you preview real-time metrics and traces next to your events
Unlock Use Cases With a Platform That Meets All Your Needs
With Splunk, you quite literally get the best of both worlds.
On the one hand, you have the Splunk platform: the best-in-class logging capabilities, with a terabyte-scale platform that helps practitioners easily search across thousands of sources. In addition, with SPL, Splunk users can create incredible visualizations and custom reporting so anyone in their organization can surface and understand unique meaningful insights from their environments.
On the other hand, you have Splunk Observability Cloud: an intuitive full-stack platform that combines a wide range of monitoring solutions: Splunk Infrastructure Monitoring, Splunk APM, Splunk Real-User Monitoring, and Splunk Synthetic Monitoring. And because it’s OpenTelemetry-native, you only need to instrument once as you build new applications, making data ingestion easy without relying on one single vendor.
By combining the two, ITOps and engineering professionals enjoy a flexible, scalable, and comprehensive platform that meets all their needs, from data ingestion to searches, visualization, quick troubleshooting, and monitoring.
See it for yourself — try Splunk Observability Cloud for free for 14 days!
Related Articles

Announcing the General Availability of Splunk POD: Unlock the Power of Your Data with Ease
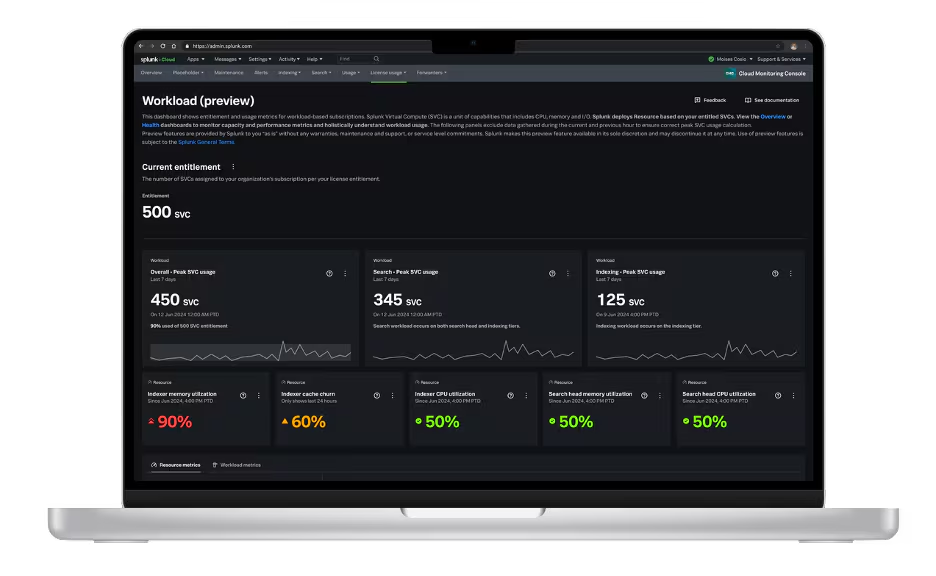
Introducing the New Workload Dashboard: Enhanced Visibility, Faster Troubleshooting, and Deeper Insights
Leading the Agentic AI Era: The Splunk Platform at Cisco Live APJ

Dashboard Studio: Token Eval and Conditional Panel Visibility
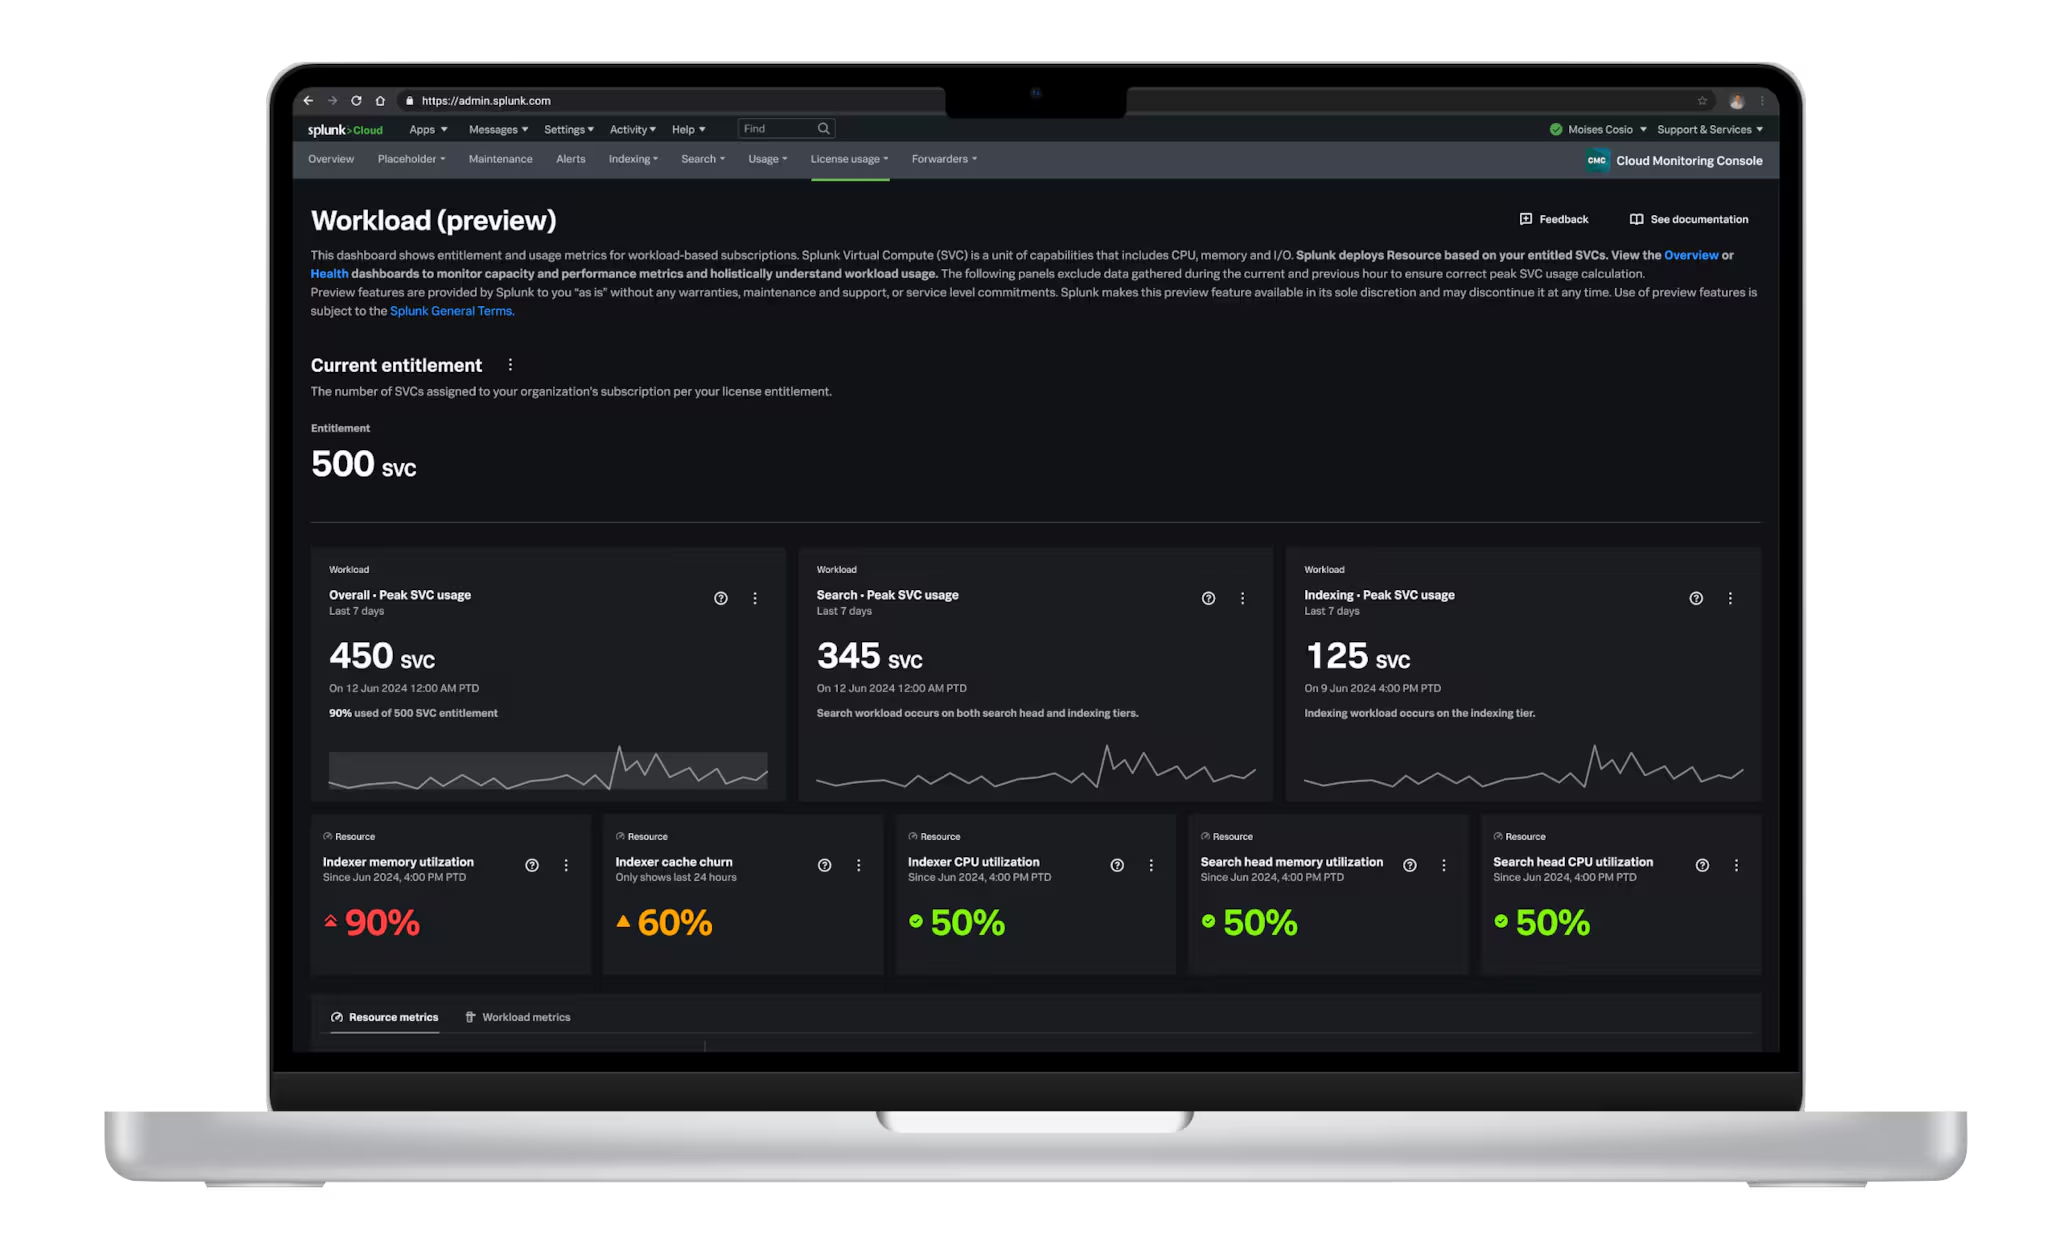
Introducing Resource Metrics: Elevate Your Insights with the New Workload Dashboard
Powering AI Innovation with Splunk: Meet the Cisco Data Fabric

Remote Upgrader for Windows Is Here: Simplifying Fleet-Wide Forwarder Upgrades
Dashboard Studio: Spec-TAB-ular Updates
