Dashboard Studio: Spec-TAB-ular Updates
Splunk Cloud Platform 10.0.2503 includes a number of new Dashboard Studio features:
-
Tabbed dashboard updates:
- Ability to export one or multiple tabs
- New "Switch tab" interaction
- UI to select a tab when configuring a Link to Dashboard interaction or saving a visualization from Search
-
Trellis for Area, Line, Bar, and Column charts
-
UI to configure dynamic coloring for Maps
-
Ability to view token values in source
-
Specific dashboard zoom control
Tabbed Dashboard Updates
Tabbed dashboards were first made available in Splunk Cloud Platform 9.3.2406 and Splunk Enterprise 9.4, at which time only one tab could be downloaded at a time. Now, in Splunk Cloud Platform 10.0.2503, you will be able to select one or multiple tabs for download. Note that the download button has been moved out of the Actions dropdown and into the dashboard menu.

If your dashboard has multiple tabs, you can apply a new interaction to switch between tabs. In the UI, you can select a tab to switch to.

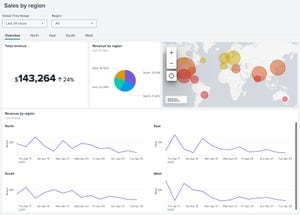
In the source code, you can dynamically select a tab with the use of tokens. In this example, the dashboard has been configured such that when a user selects a slice of the pie chart, they will be taken to the respective tab. First, each tab's ID is updated to include the region name in source (for example: "tabID": "layout_west"). Then, the pie chart's event handler is populated with the tabID based on the selected pie slice:
"eventHandlers": [
       {
          "type": "drilldown.switchToTab",
           "options": {
               "tabId": "layout_$row.Region.value$"
           }
       }
   ],
It is also now possible to select which tab you want to land on when saving a visualization from search or linking to a dashboard with tabs. When saving a visualization from search, you will see an updated modal which allows you to browse existing dashboards via keyword search, view the owner and permissions of the dashboard, and select a tab, when applicable.

Similarly, when creating a drilldown link to a dashboard with tabs, you will be able to select which tab you want the user to land on.

Trellis for Area, Line, Bar, and Column charts
As of Splunk Cloud Platform 10.0.2503, Dashboard Studio has expanded support for trellis layout beyond single value visualizations to the following axes charts: area, line, bar, and column. To apply trellis layout, just toggle "Trellis layout" under Data display. Then, you will have the option to select how you want to split the chart, how many columns and components per page, and column and row height.

Dynamic Coloring for Maps
Previously, if you wanted to add dynamic coloring to marker or bubble maps, you needed to configure everything in source. Now, UI is available to specify range value or match value coloring. You can use a provided color palette or create your own.

Ability to View Token Values in Source
In the prior switch to tab example, we needed to use the source editor to modify the event handler to use a token ("tabID": "layout_$region$"). In this scenario, it's important to ensure that the token value returned actually matches the tabID (for example, layout_west versus layout_West). Previously, the only way to do this would be to go back to the UI editor and manually check the token value. Now, you can see a token's value by simply hovering over it in source. In the below screenshot, "Value: North" is displayed when hovering over $region$ in the SPL query.

You will also be informed if no token value is set:

Specific Dashboard Zoom Control
We have heard multiple suggestions to allow more control over the zoom level on dashboards, because sometimes 75% is too small and 100% is too big. Now you can specify any numeric value to get just the right level of zoom on your dashboard.

Coming Soon
Check out Dashboard Studio and send in your feedback through Splunk Ideas, and you might see your feature request listed on a future blog's "coming soon" list! We are continuing to work on new capabilities, which are delivered incrementally with Splunk Cloud Platform and Splunk Enterprise releases.
Next up….
- Custom visualizations
- Conditional logic for show/hide
- New timeline visualization
Helpful Resources
- Dashboard Studio demo
- Dashboard Studio Blogs – Catch up on our other recent updates with Studio
- Dashboard Studio Tutorial
- Improving Dashboard Performance and Resource Usage Tech Talk
- Splunk Dashboard Studio Documentation
- Splunk Ideas – Dashboard Studio for feature or enhancement Requests
- Examples Hub – Find the Examples Hub from the Dashboards page in Search & Reporting
- Splunk Community – Dashboards & Visualizations for questions
* This information is subject to change at any time, at the sole discretion of Splunk Inc. and without notice. This roadmap information shall not be incorporated into any contract or other commitment. Splunk undertakes no obligation to either develop or deliver any product, features, or functionality described here.
Related Articles

Powering AI Innovation with Splunk: Meet the Cisco Data Fabric
Dashboard Studio: Spec-TAB-ular Updates