4 RAG Metrics to Improve Retrieval and Generation
Artificial Intelligence Pratik BhavsarKey Takeaways
- RAG systems are difficult to debug because failures stem from complex interactions between retrieval and generation; measuring these components separately is essential for systematic improvement.
- Context Relevance and Chunk Relevance identify failures in the retrieval phase, while Context Adherence and Completeness pinpoint issues within the generation phase.
- Systematic iteration involves changing one variable at a time, such as embedding models, chunking strategies, or top-k settings, and using these four metrics to validate the impact on system performance.
RAG is the default architecture for domain-specific generative AI, and it is also one of the hardest systems to debug. When a response comes back wrong, the cause could be the chunking strategy, the embedding model, the top-k setting, the reranker, the prompt, or the model itself. Most teams work through that list by trial and error, changing one thing at a time and judging the result by reading a handful of outputs.
There is a better way to do this, and it starts with measuring the two halves of the system separately. This guide covers four evaluators that tell you whether a failure came from retrieval or from generation, how to instrument a RAG pipeline to produce them, and how to run the experiments that turn those numbers into a better system.
Brief overview: RAG
RAG retrieves relevant context from external sources, combines it with the user's query, and feeds the augmented prompt to a language model. Building the system means chunking your text, embedding the chunks and loading them into a vector database. Then, at query time, three things happen in sequence:
- Retrieve: Embed the user query into the same vector space and retrieve relevant context from the knowledge source.
- Augment: Combine the query and the retrieved context into a prompt template.
- Generate: Feed the retrieval-augmented prompt to the LLM to produce the final response.
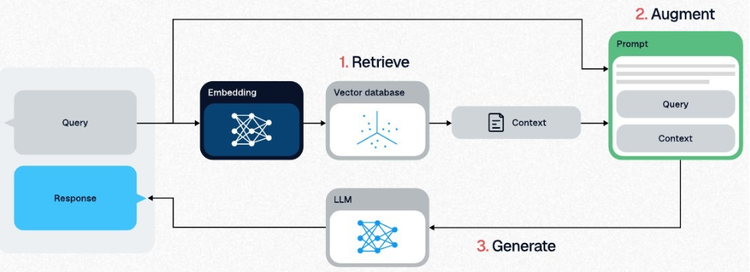
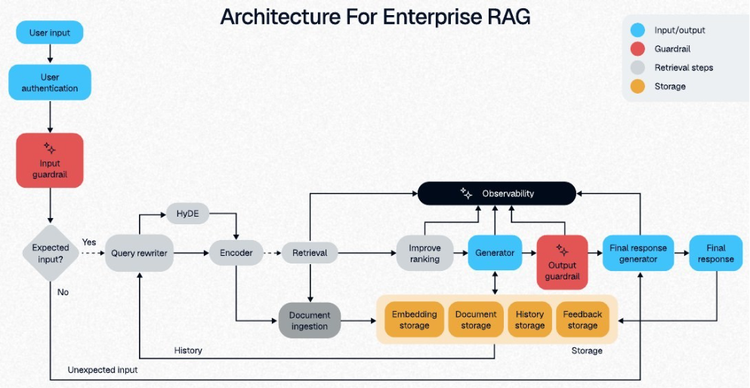
A basic system needs four components: a vector database to store embeddings, an embedding model to create them, an LLM to generate responses, and an orchestration tool to coordinate the workflow. An enterprise system needs considerably more — storage, guardrails, reranking, observability — each of which is a topic in its own right.
Why RAG systems are hard to debug
Before reaching for metrics, it helps to know what you are looking for. RAG systems fail in seven documented ways and knowing which one you are hitting determines where to spend your effort.
Notice how they cluster. FP1 through FP3 are retrieval problems. FP4 through FP7 are generation problems. Any useful measurement has to tell you which side of that line you are on, because the fixes have nothing in common — one sends you to your chunking strategy and embedding model, the other to your prompt and your context window.
Metrics for improving RAG system quality
Two evaluators measure retrieval quality, and two measure generation quality. Together they localize almost every RAG failure to one half of the system.
Context relevance
Context Relevance asks whether the retrieved context, taken as a whole, contains enough information to answer the query. It is the first thing to check, because if the answer never made it into the context then nothing downstream matters. A low score points at your embedding model, your chunking strategy, or a genuine gap in your corpus.
Chunk relevance
Chunk Relevance goes one level deeper and asks, for each retrieved chunk, whether it contains information that could help answer the query. It is binary: each chunk is either Relevant or Not Relevant. The evaluator is deliberately lenient — partial relevance counts, and a chunk is not penalized for being incomplete.
Where Context Relevance tells you whether retrieval worked, Chunk Relevance tells you which chunks let you down. Start with the first, drill down with the second. If most chunks come back Not Relevant while responses are still acceptable, you are retrieving more than you need and can cut top-k to reduce cost and latency without hurting quality.
Context adherence
Context Adherence measures closed-domain hallucination: cases where the model said things that were not provided in the context. It ranges from 0 to 1. A response close to 1 contains only information given in the context; a response close to 0 is likely to contain facts that were never provided.
This is the metric to alert on. A drop here means the system is generating ungrounded content, and it is the failure most likely to reach a customer before it reaches you.
Completeness
Completeness measures how thoroughly the response covered the relevant information available in the context. The relationship to Context Adherence is the useful part: adherence answers "is the response consistent with the context?" while completeness answers "is the relevant information in the context fully reflected in the response?"
If Context Adherence is precision, Completeness is recall. You need both, because a response can be perfectly grounded and still miss two thirds of what was asked. One caution when tuning: do not push the model toward padding responses with marginally relevant material just to raise the score.
Two metrics to add later
Once the core four are in place, two more evaluators sharpen the picture on ranking quality:
- Context Precision measures the percentage of relevant chunks in the retrieved context, weighted by their position — which catches the case where the right chunk was retrieved but buried.
- Precision @ K measures the percentage of relevant chunks among the top K at a specific rank position.
Both build on Chunk Relevance, so enable that first.
What these metrics catch: A real-world example
Consider a question about a fictional company TechABC's revenue growth in fiscal year 2024, against a corpus of company filings.
The response ignores the chunk holding the actual answer and uses generic company information instead. This happens because the embedding model ranked chunks by surface-level similarity — "TechABC" appears in all three — rather than by whether they answer the question.
Run the evaluators and the diagnosis is immediate. One of three chunks is Relevant. Context Relevance comes back around 0.4, because the context as a whole lacks focus on what was actually asked. Context Adherence sits near 0.3, since the response includes generic information not grounded in the part of the context that mattered.
The important conclusion is what those numbers rule out. The LLM is not the bottleneck, and neither is the prompt. Two thirds of the retrieved context is irrelevant, which points squarely at the embedding model.
Instrumenting and evaluating a RAG System
Let's put it all together by walking through how you'd build and instrument a RAG system in practice. We'll use the example of a question-answering system for beauty products, extracting synthetic questions from product descriptions and using them to test retrieval and generation quality.
Here's a breakdown of the steps you'd take to build and evaluate a Q&A system like this:
- Prepare the vector database
- Generate test questions
- Define your QA chain
- Choose your evaluation metrics
- Run the evaluation
- Experiment and iterate
Step 1: Prepare the vector database
Start by chunking your source documents and loading them into a vector database. For this example, we used a dataset of ~500 product descriptions from an e-commerce catalog.
Because the descriptions were short, a naive chunking configuration (a large default chunk size) resulted in one chunk per product — useful for illustrating what can go wrong with default settings, since it doesn't actually test how the system handles longer, denser documents. To make retrieval easier to evaluate, each chunk was prefixed with its product name so that queries mentioning the product would align well with the right chunk.
Any vector database (self-hosted or managed) works here, the important part is treating chunking strategy as a variable you'll want to experiment with later, not a one-time setup decision.
Step 2: Generate test questions
Since the dataset only contained product descriptions, test questions had to be generated rather than sourced from real user queries. An LLM was prompted with a few-shot template — a couple of example product descriptions paired with the kinds of questions a user might ask — and asked to generate five distinct, moderately difficult questions per product, explicitly referencing the product name.
This is a generally useful pattern for bootstrapping an eval set before you have real usage data: generate synthetic questions from your own content, then validate that they're reasonable before using them for evaluation.
Step 3: Define Your QA Chain
The QA chain itself follows the standard RAG pattern:
- A retriever pulls the top-k most relevant chunks from the vector database for a given question.
- Those chunks are formatted and inserted into a prompt template alongside the question.
- The prompt instructs the LLM to answer strictly based on the provided context (to reduce hallucination).
- The LLM generates the final response.
This can be built with any orchestration approach as long as you have a way to swap out the retriever's parameters (k, embedding model) and the LLM independently, since you'll be testing combinations of both.
Step 4: Choose your evaluation metrics
To evaluate the system, track a combination of:
- RAG-specific quality metrics: Context adherence (does the response stay grounded in the retrieved context?), completeness (does the response use enough of the relevant context?), chunk attribution (which chunks actually contributed to the answer?), and chunk utilization (how much of each attributed chunk was actually used?).
- Safety metrics: PII detection, toxicity, and tone. These are useful even in a product-QA context, since you want to catch cases where retrieved context or generated responses leak sensitive information.
- System metrics: Latency and cost per query, so quality improvements can be weighed against their operational cost.
- Custom metrics: Anything specific to your use case. For example, response length, if verbosity matters to your product.
Most eval platforms (open-source or commercial) support this general categorization: retrieval-quality, generation-quality, safety, and system metrics, computed per-response and aggregated per-run.
Step 5: Run the Evaluation
Run a representative sample of your test questions through the chain, logging each response along with its inputs, retrieved context, and computed metrics. However you do this — a hosted eval platform, a self-built logging pipeline, or a simple structured spreadsheet — the goal is the same: end up with a table where each row is one question/response pair, and each column is a metric, so you can slice by configuration and compare runs side by side.
Tagging each run with its configuration (embedding model, chunk size, top-k, LLM version) up front makes this comparison much easier later.
Experimenting and iterating RAG systems
With a baseline evaluation running, you can now experiment systematically. The goal at each step is to change one variable, keep everything else constant, and use your guiding metric (context adherence, in this case, since it's the strongest signal for hallucination) to decide whether the change helped.
Select the embedding model
Holding the chunking strategy, LLM, and top-k constant, compare several embedding models — for example, a couple of open-source options at different dimensionalities alongside a couple of proprietary options. Context adherence is a good metric to optimize for here, since it's most directly tied to hallucination. In practice, mid-sized proprietary embedding models often outperform both much smaller open-source models and the largest proprietary ones on adherence, which is a useful reminder that bigger isn't always better for retrieval — it's worth testing rather than assuming.
Once you've picked a winning embedding model, drill into individual low-scoring examples. Inspect the retrieved chunks directly: if none of them actually support the claim in the generated response, that's a clear case of retrieval failing to ground the generation — not a generation problem to fix with prompting.
Select the right chunker
Next, with the winning embedding model held constant, compare chunking strategies — for example, sentence-based splitting versus fixed-size recursive splitting with a smaller chunk size and some overlap. Smaller, more targeted chunks often improve adherence noticeably, since the model has less irrelevant text to sift through per chunk.
Improve Top-K
If chunk attribution stays low across experiments (i.e., only a small fraction of retrieved chunks are ever actually used in the response), that's a signal you're retrieving more chunks than necessary. Try reducing top-k and re-running the evaluation — you'll often find that attribution and adherence both improve, while cost drops, since you're sending less irrelevant context to the LLM.
Improve cost and latency
Finally, test whether you can swap in a faster, cheaper LLM version without meaningfully hurting quality. This usually comes with some tradeoff — for example, a meaningful drop in latency and cost alongside a modest drop in adherence. Whether that tradeoff is worth it depends entirely on your use case: a customer-facing support bot might prioritize adherence, while an internal research tool might prioritize speed and cost.
Splunk Agent Observability
The complexity of RAG is what makes measurement worth the setup cost. Four evaluators turn a system with a dozen interacting variables into one where every change produces a number you can compare against the last.
That is the difference between tuning a RAG system and guessing at it. Instrument first, establish a baseline, then change one variable at a time and let the evaluators tell you whether you improved anything. Most teams find the first real win in their top-k setting, which costs nothing to change and is almost always set too high.
Understanding your RAG system at work is key to trusting AI systems. Learn about Splunk Agent Observability and get hands-on with the Splunk Observability Cloud Free Edition today