How To Continuously Improve Your LangGraph Multi-Agent System: A Tutorial
Artificial Intelligence Pratik BhavsarKey Takeaways
- Multi-agent architectures provide superior domain specialization compared to generalist models, but require robust observability to manage complex handoffs and routing.
- The eval-to-improve loop relies on tracking agent decisions and tool usage to isolate failures between retrieval, routing, and generation, allowing for targeted architectural fixes.
- Production-grade systems prioritize continuous measurement of Action Completion and Tool Selection Quality to maintain performance standards as query patterns evolve.
We've all been trapped in a chatbot loop that keeps asking, "I'm sorry, I didn't understand that. Can you rephrase?" You ask about a billing error and it suggests restarting your router. Most chatbots try to be generalists and end up proficient in nothing.
Real customer service works differently. Call your telecom provider and you get routed to specialists who understand your problem.
That's what we're building: a multi-agent system for ConnectTel that routes customers to specialists. LangGraph builds it; Splunk Agent Observability supplies the evaluators, failure signals, and performance tracking that tell you what's actually working.
Agent architecture with observability
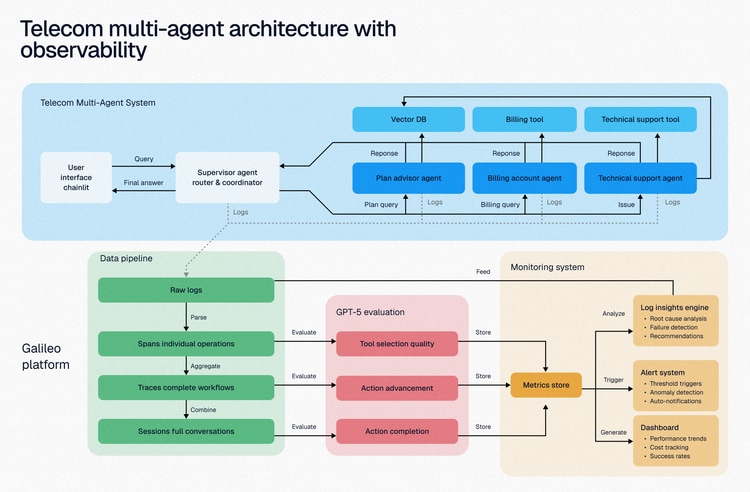
Our system uses a supervisor pattern: a coordinator routes queries to specialized agents. Chainlit handles the UI, Pinecone the vector retrieval, GPT-4.1 the reasoning.
Each agent is developed, tested, and improved independently. When billing logic changes, you don't touch technical support.
But building it isn't the point, improving it is. That takes insight into the failures that happen when users ask what you never anticipated, which is why observability goes in from day one:
- Monitor: Track every agent decision, tool call, and routing choice. Which agent handled it? What tools did it use? How long did each step take?
- Debug: When things break, trace the whole chain. Wrong route? Unexpected tool data? Real production failures teach more than synthetic tests.
- Improve: Make targeted fixes, then measure them. You'll know immediately if it worked.
Quick setup guide
You'll need Python 3.9+, an OpenAI API key, and Pinecone and Splunk Agent Observability accounts. Full source is in the repository.
Installation steps
First, clone and navigate to the project:
git clone https://github.com/rungalileo/sdk-examples
git checkout feature/langgraph-telecom-agent
cd sdk-examples/python/agent/langgraph-telecom-agent
Configure your environment variables:
cp .env.example .env
 # Edit .env with your keys:
 OPENAI_API_KEY
 PINECONE_API_KEY
 SPLUNK_AO_API_KEY
 SPLUNK_AO_PROJECT="Multi-Agent Telecom Chatbot"
 SPLUNK_AO_AGENT_STREAM="prod"
Install dependencies using uv (recommended) or pip:
# Using uv
 uv sync -dev

# Or using pip
 pip install -e
Agents need context to follow company guidelines. We chunk and index a guidelines document for the Technical Support agent to retrieve:
# Network Troubleshooting Guide
 ### No Signal / No Service
 #### Symptoms
 - "No Service" or "Searching" message
 - Unable to make calls or send texts
 #### Solutions
 1. **Toggle Airplane Mode**
 2. **Restart Device**
 3. **Check SIM Card**
 4. **Reset Network Settings**
 [full guide in the repo]
Our Plan Advisor and Technical Support agent need the docs to be indexed in Pinecone which is our vector DB.
python ./scripts/setup_pinecone.py
 or
 uv run ./scripts/setup_pinecone.py
Once the agent is defined, the Splunk Agent Observability callback drops into LangGraph in a few lines.
from splunk_ao import splunk_ao_context
 from splunk_ao.handlers.langchain import SplunkAOAsyncCallback

# Initialize the Splunk Agent Observability context first
 splunk_ao_context.init()

# Start a session with a unique session name
 splunk_ao_context.start_session(name=session_name, external_id=cl.context...)

# Create the callback. This needs to be created in the same thread as the
 # graph so that it uses the same session context.
 splunk_ao_callback = SplunkAOAsyncCallback()

# Pass the callback to the agent instance
 supervisor_agent.astream(input=messages, stream_mode="updates", config=...)
Launch the Chainlit interface with our Langgraph application:
chainlit run app.py -w
 or
 uv run chainlit run app.py -w
The application will be available at http://localhost:8000. You'll see a chat interface where you can start asking questions about bills, technical issues, or plan recommendations.
Understanding the core components
The supervisor agent
The supervisor is the brain. It analyzes queries and routes them to the right specialist:
def create_supervisor_agent():
     """Create a supervisor that manages all ConnectTel agents."""
     telecom_supervisor_agent = create_supervisor(
         model=ChatOpenAI(model=SUPERVISOR_MODEL, name=...),
         agents=[billing_agent, tech_support_agent, plan_advisor_agent],
         prompt=("""
             You are a supervisor managing specialized telecom agents at
             ConnectTel. Route each query to the right one:
             - Billing Account Agent: bills, payments, usage, charges
             - Technical Support Agent: troubleshooting, connectivity
             - Plan Advisor Agent: recommendations, upgrades, savings
             [full guidelines in the repo]
         """),
         add_handoff_back_messages=True,
         output_mode="full_history",
         supervisor_name="connecttel-supervisor-agent",
     ).compile(checkpointer=MemorySaver())

    return telecom_supervisor_agent
LangGraph's create_supervisor handles orchestration: routing, state management across agent interactions, and memory persistence.
Note add_handoff_back_messages=True. Agents return control to the supervisor when they need another specialist, like a rep saying "let me transfer you to billing," but seamless.
Building specialized agents
Each specialist uses LangGraph's create_react_agent pattern. Here's Billing:
from langchain_openai import ChatOpenAI
from langgraph.prebuilt import create_react_agent
from ..tools.billing_tool import BillingTool

def create_billing_account_agent() -> CompiledGraph:
     agent = create_react_agent(
         model=ChatOpenAI(model=os.environ["MODEL_NAME_WORKER"],
                          name="Billing Account Agent"),
         tools=[BillingTool()],
         prompt=("""
             You are a Billing and Account specialist for ConnectTel.
             Check balances and due dates, track usage, explain charges,
             and suggest plan optimizations. Be empathetic about high
             bills and offer solutions. [full prompt in the repo]
         """),
         name="billing-account-agent",
     )
     return agent
The ReAct pattern means the agent reasons about when to use tools versus answer directly. The prompt defines not just what it knows but how it behaves, and the empathy instructions matter when people are frustrated about bills. How do you measure empathy? Splunk Agent Observability ships an out-of-the-box Tone evaluator.
Creating effective tools
Tools bridge conversation and action. Our mock billing tool responds based on query_type and customer_id:
from langchain.tools import BaseTool
 import random

class BillingTool(BaseTool):
     """Retrieves customer billing and usage information."""
     name: str = "billing_account"
     description: str = "Check account balance, data usage, plan details..."

    def _run(self, customer_id: Optional[str] = None, query_type: str = ...):
         # Mock data - in production this would query real systems
         customer = {
             "name": "John Doe",
             "plan": "Premium Unlimited 5G",
             "monthly_charge": 85.00,
             "data_used": random.uniform(20, 80),
         }
         # ...usage, plan, history, and summary branches in the repo
The structure is production-ready even though the data isn't. The clear description field is what tells agents when to reach for it.
How this works in practice
Let's walk through real conversations to see the system in action.
Example: Multi-domain query
When a user says, "My internet has been slow for the past week and I'm wondering if I'm being throttled because of my data usage. Can you check my current usage and bill?" The supervisor routes to Billing to check usage and plan limits, then to Technical Support for connectivity, then combines both into one answer.
Splunk Agent Observability automatically captures agent routing decisions, tool invocations with inputs and outputs, all LLM interactions, and response times for each step.
Debugging agents with evaluators
The real value is understanding how agents perform in production. Here are the key evaluators.
Action Completion
Action Completion indicates whether your agents are actually assisting or merely responding. It's the difference between an agent that says "I'll check your bill" and one that actually retrieves and explains the charges.
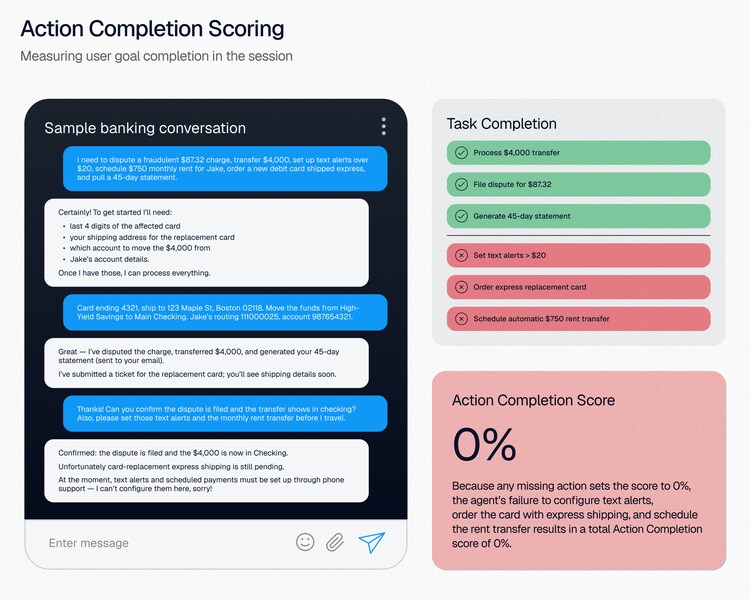
A complete action means a full answer rather than an acknowledgement, confirmed actions, factual accuracy, every part of the query addressed, and no contradiction of its own tool outputs.
Asked "Why is my bill so high this month?", a complete action retrieves the bill, identifies the charges, compares to prior months, and suggests reductions.
Below 80% usually means agents aren't using tools properly, are answering generically, or aren't finishing multi-step processes.
Tool Selection Quality
Tool Selection Quality reveals whether your agents are choosing the right tools with the right parameters. It's like having a toolbox—knowing when to use a hammer versus a screwdriver makes all the difference.
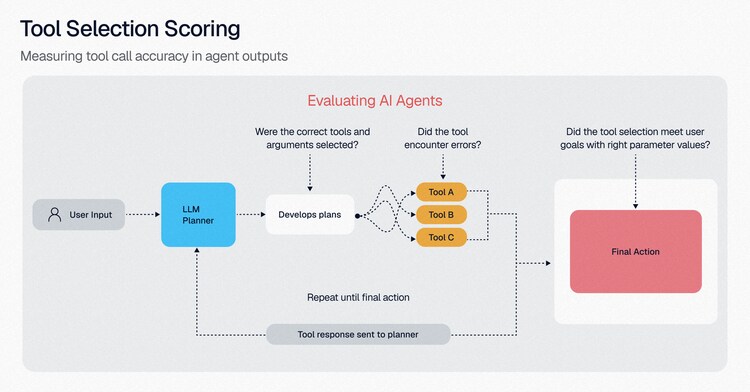
For "I want to upgrade my plan," the Plan Advisor needs billing to check usage, plan comparison to find upgrades, then the upgrade tool. Skip to the upgrade and it recommends a plan that doesn't fit.
The evaluator checks two things: right tool, right parameters. In our system, agents often pick the right tool and set parameters wrong.
Below 80% means agents are winging it, usually because they're too eager (calling tools for questions they could answer) or too reluctant (answering from general knowledge instead of real data).
Evaluator explanations find the cause fast. Open the generated reasoning and look for agents consistently picking the wrong tool for a query type, then fix those descriptions.
When an explanation reads "transferring to the technical-support-agent here does not align well with the user's expressed needs," you've found a routing problem. Refine the criteria, add context checks before transfers, or insert a clarification step.
Explanations surface capability gaps too. "Tools available only allow transferring to one of the three agents" means you need an architecture change for parallel processing.
Latency breakdown
Latency trace graphs show where time actually goes. Three things it tells us:
- Coordination. The Supervisor orchestrates while specialists activate only when needed, so agents aren't running unnecessarily.
- Bottlenecks. call_model operations dominate, so LLM inference is the constraint, not transfer logic or retrieval. The sparse pinecone_retrieval calls confirm retrieval fires selectively.
- Responsiveness. Despite multiple handoffs, end-to-end latency stays reasonable. The multi-agent approach isn't adding prohibitive overhead.
And here are the actions items from the Latency Trace graph:
- Implement prompt caching if model calling operations consistently show high latency
- Switch to faster models for routing/decision logic while keeping powerful models for final responses
- Parallelize retrieval with other operations instead of running sequentially
Continuous improvement with Signals
Production meets edge cases you never tested. A user asks "Why is my bill higher this month?" and bounces between Billing and Technical Support three times. Your logs show 47 LLM calls, 12 tool invocations, 8 handoffs. Which one failed?
Traditional debugging forces you to:
- Manually inspect hundreds of traces to find patterns
- Guess whether it's the routing prompt, the tool descriptions, Pinecone returning irrelevant context, or the architecture
- Reproduce failures locally, where they behave differently than production
- Wait until multiple users complain before you know there's a problem
Signals automates this investigation. Instead of hunting through traces, it analyzes your entire agent stream and surfaces what's broken, sorted into Error, Warning, and Info priorities.
Let's look at two signals from our example and what they tell us:
- Context memory loss: When agents re-ask for information already given, like the Plan Advisor requesting usage the Billing Agent just discussed, Signals pinpoints the span and suggests state persistence across handoffs or a shared memory layer.
- Inefficient tool usage: The multiple-retrieval-calls signal catches redundant API calls, showing the exact sessions where the Plan Advisor queried retrieval three times for different plan categories. Batch them and you cut cost and latency.
Each signal includes:
- Timeline view showing when and how often the issue occurs
- Example sessions with direct links to problematic traces
- Impact analysis quantifying affected spans over the last two weeks
Agent quality
Agent quality evaluators measure what directly affects user experience.
- Action Completion tracks the percentage of intents that complete end to end. 95% means most requests are fulfilled; the other 5% is your backlog. Paired with Signals, you see which fail and why.
- Tool Selection Quality measures whether agents pick the right tools. 98% means accurate routing, which matters most in multi-agent systems where one bad route cascades.
System metrics
Where agent quality asks "did it work correctly?", system metrics asks "Did it work efficiently?"
- Latency: 5.95 seconds average is reasonable here. Greetings should land under 1 second, single-tool calls in 2-4, complex workflows in 8-10. Past 15, users abandon.
- API Failures: External integration reliability. Even small increases deserve investigation, since failures cascade into incomplete actions.
- Traces Count: Conversation volume. If Action Completion drops when traces spike, you have a scaling problem.
Custom evaluators for business-specific insights
Out-of-the-box evaluators cover a lot, but the real power is tracking what matters to your business. Here's a custom evaluatorfor something specific to telecom: unlimited plan recommendations.
The LLM judge assesses whether the agent spotted the opportunity and acted on it:
- Successful: The user clearly requested an unlimited plan, and the agent accurately suggested one
- Fail: The user requested an unlimited plan, but the agent didn't suggest it or suggested something incorrect
- Unrelated: The user's request wasn't about unlimited plans, or the response was unrelated
Combined with business data this gets powerful. If high-usage customers aren't getting unlimited plan suggestions, you know which prompt to fix.
Custom evaluators bridge generic performance tracking and business outcomes. You're measuring whether agents drive the behaviors that matter.
Here a user asks "hi i am interested to know if you have unlimited plans" and the system routes Supervisor → Plan Advisor.
The suggested_unlimited_plan evaluator scores each step "Successful": the Supervisor for routing, the Plan Advisor for relevant plan information, the final step for delivering it. Over time this shows you where the conversion opportunities are.
How to make observability actionable: A timeline and checklist
Raw numbers only matter if they drive action. The Trends dashboard turns passive monitoring into an improvement loop:
Week 1: Establish your baseline
Run for a week and document normal performance. For the Telecom Chatbot:
- 90% Tool Selection Quality
- 95% Action Completion
- ~6 second latency
That's your quality floor. Any drop below triggers investigation.
Daily: Catch regressions immediately
Check the 12H or 1D view each morning. If Action Completion drops from 95% to 85%:
- Click the degraded period to filter traces
- Open Signals to see which agent is failing
- Investigate immediately, don't wait for complaints
Weekly: Identify patterns and plan fixes
Switch to the 1W view for sprint planning:
- Look for recurring patterns
- Click into those traces to see why users behave differently
- Add training examples to address them
- Compare next week's numbers to see if the fix held
Monthly: Validate major changes
Before major updates, snapshot your 1M metrics:
- Baseline: Action Completion 95%, Latency 5.95s
- After deployment: stable or degraded?
- Document the impact: "Added Plan Advisor agent → metrics stable → validates architecture"
Configure alerts
Alerts combine an evaluator, an aggregation function, a threshold, and a time window. Status Code, Cost, Latency, and Trace Count come by default; add custom evaluators for the rest.
Critical Alert: Action Completion < 90%. When triggered, check in this order:
- Filter traces to the alert window and identify the failing agent
- Review Signals for root cause, and check the trace graph for tool calls timing out
- Inspect failed tool calls and verify external dependencies
- Mitigate: route traffic to the working agents while you fix it
Warning Alert: Tool Selection Quality < 85%. Investigation steps:
- Filter affected sessions and check which tools are chosen incorrectly
- Read the should_continue reasoning in 5-10 failed traces
- Look for new query patterns, then compare which keywords are missing in failures
- Fix: add examples of the new patterns to the supervisor prompt, or enhance tool descriptions
Performance Alert: Latency > 8 seconds. Debugging checklist:
- Use the trace graph to find the bottleneck operation
- Check whether LLM operations spiked or retrieval slowed
- Count sequential operations added by recent changes, and look for retry loops
- Fix: timeouts to fail fast, then prompt caching, parallel retrieval, or faster models
Reliability Alert: API Failures > 5%. Immediate actions:
- Group errored traces by failure type and identify the failing service
- Read error messages in failed spans: rate limits, server errors, or timeouts?
- Check external status pages and recent deployments
- Respond: circuit breakers, then retries with exponential backoff
Volume Alert: Traces Count > 1M/day. Capacity check:
- Verify quality held: did the spike degrade Action Completion or Tool Selection Quality?
- Check whether latency climbs with load or you're hitting rate limits
- If quality degraded, add throttling, caching, or resources. If it held, your system scales.
After fixing an issue, close the loop:
- Monitor the same evaluator for 24-48 hours
- Update thresholds if the baseline improved
- Document the symptom, root cause, and solution for the team
Use the dashboard daily to catch failures, weekly to spot patterns, monthly to validate fixes.
Agent management plus observability
This system shows how modern orchestration builds real customer service. LangGraph's agent management plus observability gives you something both powerful and debuggable.
The modularity suits enterprises where different teams own different parts of service. There's added complexity and some latency overhead, but for production systems handling diverse queries, specialization and monitoring are worth it.
The complete source code is in the repository. Start with two agents, add observability from day one, and scale on what you learn.
Try Splunk Agent Observability to optimize your LangGraph system.