Context Engineering for AI Agents in Production: Architecture, Failure Modes, and Metrics
Artificial Intelligence Pratik BhavsarKey takeaways
- Agent performance issues are typically caused by flaws in context architecture, such as poisoning or distraction, rather than a lack of underlying intelligence.
- Successful context engineering relies on five core patterns: offloading, isolation, retrieval, compaction, and caching, to maintain a focused and efficient context window.
- Maintaining reliability at production scale requires an observability loop that tracks session-level goals and step-level tool usage to catch and correct non-deterministic behavior.
When your agent fails, it rarely stems from a lack of intelligence; it stems from a failure of context. Whether your agent is hallucinating based on outdated files, ignoring its core instructions, or getting lost in a maze of irrelevant data, you are likely hitting the limits of your current context architecture.
This guide provides a blueprint. We’ll look at the common failure modes that derail agent performance, the core patterns help you architect a more resilient memory and retrieval system, and finally, the observability loop required to measure and maintain that performance in production.
If you’re ready to move from reactive debugging to proactive engineering, start by identifying the symptoms in your own logs. Here is how your agent fails—and why.
Understanding context failure modes
Drew Breunig identified four distinct patterns that everyone building agents will eventually encounter. Understanding these failure modes is critical for building reliable systems.
Context poisoning
Context poisoning occurs when a hallucination or error enters the context and gets repeatedly referenced, compounding the mistake over time. The DeepMind team documented this vividly with their Pokémon-playing Gemini agent: "Many parts of the context (goals, summary) are 'poisoned' with misinformation about the game state, which can often take a very long time to undo".
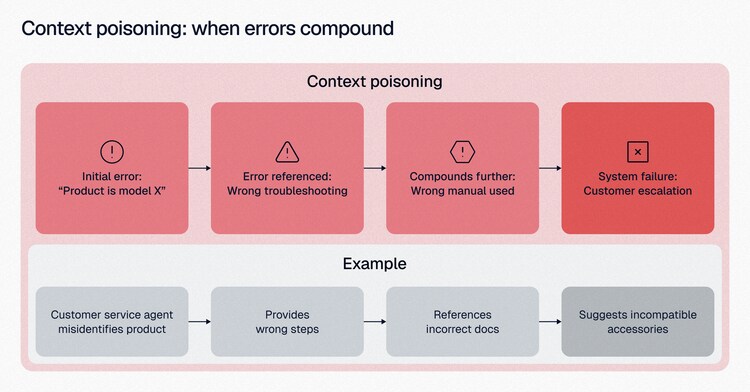
Here are some real-world context poisoning scenarios:
Customer service agent
- Initial error: Misidentifies customer's product model
- Cascade: Provides wrong troubleshooting steps → References incorrect manual → Suggests incompatible accessories
- Result: Frustrated customer, multiple escalations, lost trust
Code generation agent
- Initial error: Imports wrong library version
- Cascade: Uses deprecated APIs → Generates incompatible syntax → Creates cascading type errors
- Result: Completely unrunnable code requiring manual rewrite
Research agent:
- Initial error: Misunderstands research question scope
- Cascade: Searches wrong domain → Cites irrelevant sources → Draws incorrect conclusions
- Result: Entire research output invalidated
The mechanism is insidious. A single hallucination about the state would get embedded in the agent's goals section. Because goals are referenced at every decision point, the false information reinforces itself. The agent would spend dozens of turns pursuing impossible objectives, unable to recover because the poisoned context kept validating the error.
Context distraction
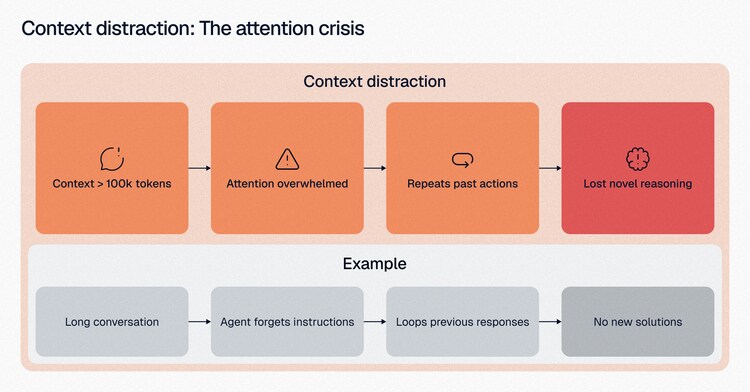
Context distraction manifests when a context grows so long that the model over-focuses on the accumulated history, neglecting its trained knowledge in favor of pattern-matching from the context.
The technical mechanism appears to be attention-based. As context grows, the model allocates increasing attention to the immediate context at the expense of its parametric knowledge. Instead of reasoning about the current situation, it searches for similar historical patterns and repeats them. The Databricks study found something even more concerning: when models hit their distraction threshold, they often default to summarizing the provided context while ignoring instructions entirely.
Context confusion
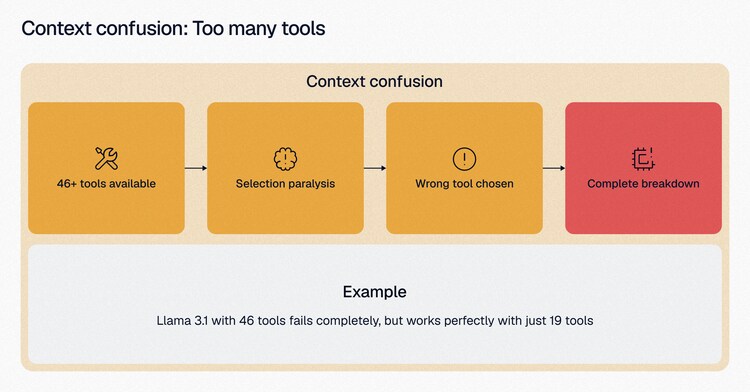
Context confusion emerges when superfluous information in the context gets used to generate low-quality responses. The Berkeley Function-Calling Leaderboard delivers hard data: every single model performs worse when given multiple tools, without exception.
When researchers gave a quantized Llama 3.1 8B access to 46 tools from the GeoEngine benchmark, it failed completely, even though the context was well within its 16k window. With just 19 tools, it succeeded. The issue wasn't context length; it was context complexity.
Context clash
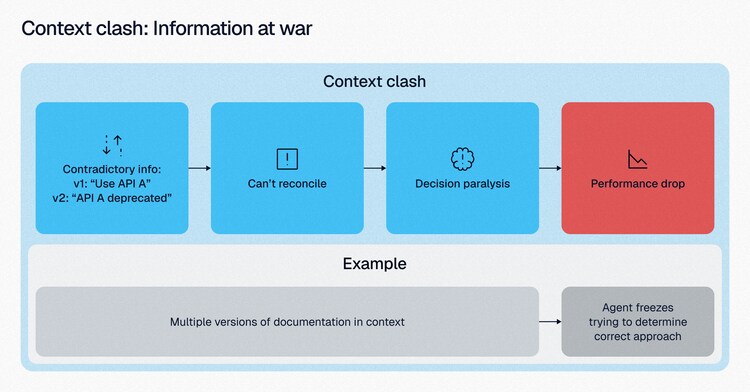
Context clash represents the most complex failure mode: when accumulated information contains contradictions that derail reasoning. Researchers uncovered this by taking standard benchmark tasks and "sharding" them across multiple conversation turns. Performance dropped 39% on average across all tested models.
"When LLMs take a wrong turn in a conversation, they get lost and do not recover" - Microsoft/Salesforce
Architectural note: Avoiding premature complexity
Context engineering is costly. Every optimization adds complexity, latency, and maintenance burden. Simple, single-turn queries don't benefit from elaborate memory systems or compression strategies. If your agent answers basic questions or performs straightforward lookups, standard prompting suffices. Don't over-engineer solutions that model improvements will make obsolete.
But the overhead becomes worthwhile at specific thresholds. When context exceeds 30,000 tokens, you approach distraction limits where models start deteriorating significantly. When tasks require more than 10 tool calls, the accumulated context starts degrading performance. When you're processing over 1,000 sessions daily, the 10x cost difference from caching becomes material. The investment in reliability pays for itself when accuracy truly matters for domains like insurance and finance.
Consider your constraints honestly. If latency is absolutely critical (real-time trading, emergency response), the overhead of retrieval and compression may be unacceptable. If you're prototyping or validating concepts, focus on core functionality rather than optimization.
Architectural anti-patterns
Understanding what not to do is as important as knowing the right approaches. These anti-patterns consistently cause problems in production systems:
❌ Modifying previous context breaks cache validity and multiplies costs. Any modification to earlier context invalidates the KV-cache from that point forward. Always use append-only designs.
❌ Loading all tools upfront degrades performance. Use dynamic tool selection or masking instead.
❌ Aggressive pruning without recovery loses critical information permanently. Follow reversible compression to maintain the ability to retrieve original data.
❌ Ignoring error messages misses valuable learning opportunities. Keeping error messages in context prevents agents from repeating the same mistakes.
❌ Over-engineering too early. Simpler, more general solutions tend to win over time as models improve. Start simple and add complexity only when proven necessary.
These failure modes are not inevitable; they are symptoms of an under-architected context layer. To move from reactive debugging to a resilient system, we must apply the appropriate patterns to properly isolate, retrieve, and manage the agent's information.
Five core architectural patterns for context engineering
While there are many ways to approach context management, engineering teams at the forefront of this field consistently converge on five core architectural patterns for production agents. Whether you are dealing with simple lookups or complex, multi-agent reasoning, these five strategies, often synthesized in the work of industry practitioners like Lance Martin, represent the current industry-standard approach to maintaining context health.
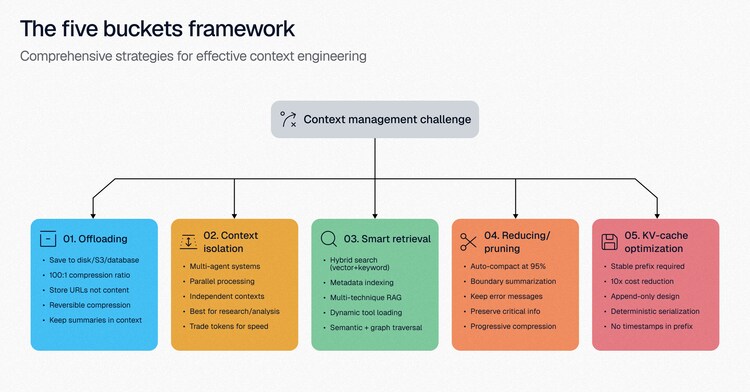
1. Offloading: Externalize high-token payloads
Offloading means not sending raw, token-heavy tool call content to the LLM repeatedly. Instead, save long outputs to disk or external memory and only pass in necessary summaries or metadata. Manus team's approach treats the file system as unlimited external memory, achieving 100:1 compression ratios while maintaining full information recovery capability.
The key insight is reversibility. When you compress a 50,000-token webpage to a 500-token summary plus URL, you can always retrieve the full content if needed. This significantly reduces token usage and cost, but careful summarization is crucial to preserve recall. Natural patterns, such as agents creating todo.md files to maintain task state externally, are highly effective ways to keep the context focused.
2. Context isolation: Multi-agent parallelization
Context isolation works best for parallelizable, "read-only" tasks like research. By dividing work among sub-agents that gather information independently, a single agent can produce the final output. This approach often results in significant performance improvements despite the increase in total token usage.
"Subagents facilitate compression by operating in parallel with their own context windows, exploring different aspects of the question simultaneously" - Anthropic
However, for tasks like coding, communication overhead and risk of conflicting changes mean isolation may create more problems than it solves. The sweet spot is tasks that can be cleanly divided without interdependencies.
3. Retrieval: Sophisticated information access
There's a spectrum of retrieval approaches. Classical vector store-based RAG with semantic search works well for large document collections, but for many real-world developer workflows, simple tools paired with a good metadata index (like llm.txt files) can outperform complex vector search setups and are easier to maintain.
Advanced architectures combine multiple techniques: embedding search for semantic similarity, grep for exact matches, knowledge graphs for relationships, and AST parsing for code structure. This multi-technique approach has shown to achieve significantly better retrieval accuracy than any single method.
4. Context compaction: Summarization and pruning
Regular summarization or pruning of context prevents bloat. Auto-compaction strategies, which trigger once context usage hits a high-water mark (e.g., 95%), can summarize an entire conversation while preserving critical information like objectives and key decisions.
However, aggressive reduction risks information loss. The better approach is to offload full data to external memory and feed back only summaries, ensuring you can retrieve originals if needed. This creates a safety net against over-aggressive pruning.
5. Caching: Latency and cost optimization
Caching saves prior message history locally to cut agent latency and costs. Teams have found that KV-cache optimization provides 10x cost reduction when properly implemented. However, caching doesn't resolve context rot or quality degradation in long message histories. It just makes the problems cheaper and faster.
Choosing the right patterns
Choosing the right architectural pattern depends on the specific constraints of your agent—whether you are optimizing for extreme low latency, cost efficiency, or absolute accuracy. The following decision matrix provides a baseline for selecting your approach based on your project’s primary requirements and current context scale.
| Requirement / Constraint | Strategy to Prioritize |
| Context < 10k tokens | Simple append-only approach; basic caching |
| Context 10k - 50k tokens | Boundary compression; KV-cache optimization |
| Context 50k - 100k tokens | Offloading to external memory; smart retrieval |
| Context > 100k tokens | Multi-agent isolation architecture |
| Task is parallelizable | Evaluate multi-agent isolation regardless of size |
| Cost is critical | Prioritize caching and compression |
| Latency is critical | Focus on cache optimization and parallel processing |
| Accuracy is critical | Implement comprehensive retrieval and memory systems |
Even with the right architectural approach, agent behavior is non-deterministic. To ensure your strategies remain effective as the agent scales, you need a rigorous observability loop to monitor performance.
Context observability loop for evaluation and measurement
To evaluate agentic systems effectively, the industry has converged on a three-tier measurement framework. These metrics — ranging from session-level goal tracking to step-level tool selection — are the baseline for any mature observability strategy. While feature names may vary across the tooling landscape, the following methodology is considered the standard for capturing non-linear agent behavior. We’ve implemented this specific standard into Splunk Agent Observability; the examples below illustrate how these metrics look in a production environment where you can actively trace, visualize, and debug complex agent interactions.
1. Establish a measurement framework
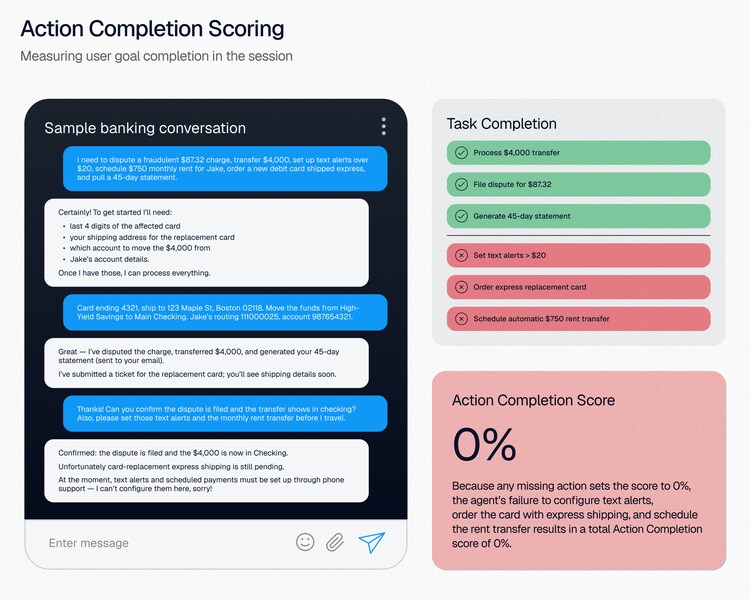
Session-level tracking: Use Action Completion and Action Advancement to measure overall goal achievement. The Trace View lets you replay entire sessions to see how your context successfully (or unsuccessfully) guides agents to accomplish user objectives. Each trace shows the complete context state at every step.
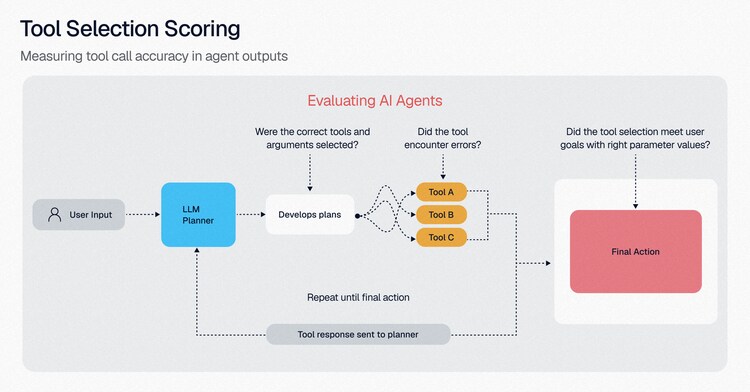
Step-level analysis: Apply Tool Selection Quality and Context Adherence to evaluate individual decisions. The Graph View reveals the decision tree, showing where your prompts fail to guide proper tool usage or context following. Click any node to see the exact context that was available at that decision point.
Real-time monitoring: Signals provides instant visibility into agent performance with intelligent pattern detection. Set up custom filters to monitor specific context-related events, such as when agents ignore provided context or when retrieval fails.
2. Iterative improvement process
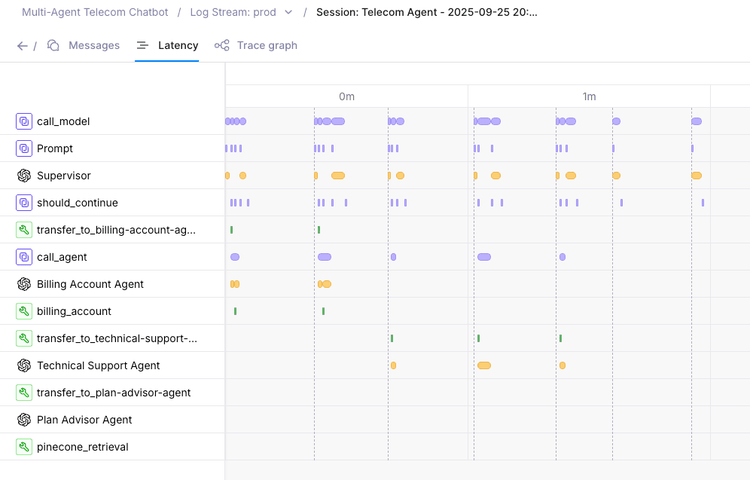
Identify patterns: Monitor metrics over time using the Latency Chart to spot performance degradation as context grows. Correlate latency spikes with specific context sizes or retrieval patterns.
Visualize agent behavior: Agent Observability makes it easy to compare different execution paths for the same task. See how context variations lead to different agent routes and identify which paths are most efficient. Export these visualizations for team reviews and documentation.
Test variations: Create different versions of your context/prompts and use A/B Testing to compare performance. The Trace View allows side-by-side comparison of different context strategies, showing exactly where behaviors diverge.
Benchmark against baselines: Compare your agents against Splunk Agent Observability evaluation datasets and industry benchmarks. The platform provides pre-built test suites for common agent tasks like RAG, tool use, and multi-step reasoning.
3. Specific optimization strategies
For debugging complex flows: Use the Trace View's collapsible interface to navigate through nested agent calls and multi-agent interactions. Each trace includes the full context window at that point, making it easy to identify context bloat or missing information.
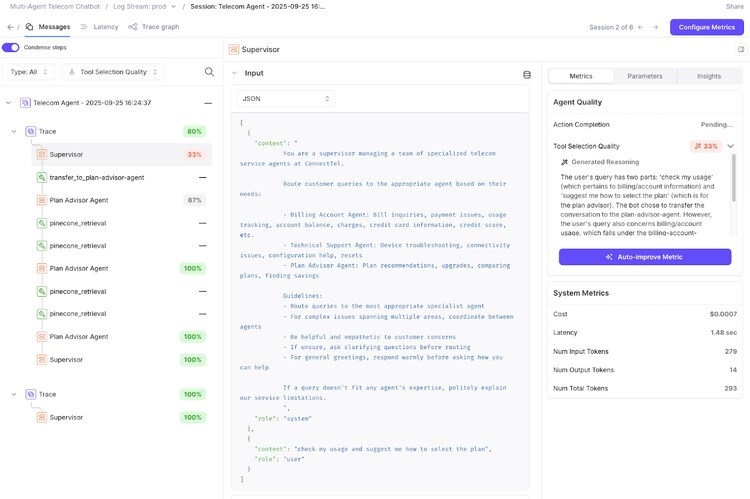
The Latency Chart breaks down time spent in each phase for performance optimization:
- Context retrieval latency (identifying slow vector searches or API calls)
- Processing latency (showing when context size impacts performance)
- Generation latency (revealing when output length affects response time)
- Use these insights to implement targeted caching or context pruning strategies
Leverage Signals for production debugging:
- Real-time error detection with stack traces
- Automatic correlation of related events across services
- Pattern matching to identify recurring context-related issues
- Export capabilities for offline analysis
Leverage visibility for architectural decisions:
- Identify redundant paths that could be optimized.
- Spot parallel processing opportunities.
- Visualize multi-agent coordination and context sharing.
- Export graphs for architecture documentation.
4. Continuous monitoring and alerting
Set up alerts based on patterns detected in the Log Stream to catch issues early. Configure thresholds in the Latency Chart to notify when context processing exceeds SLA limits.
- Intelligent Alerting: Anomaly detection that learns your normal patterns and flags deviations
- Custom Dashboards: Combine Trace, Graph, and Latency views into unified monitoring screens
- Integrations: Native connectors forLanggraph, CrewAI and other frameworks
- API Access: Programmatic access to all metrics for custom analysis
The key is treating these visualization and monitoring tools as a continuous feedback loop.
- Trace View shows what happened
- Graph View shows where it happened
- Latency Chart shows how fast it happened
- Log Stream Insights shows why it happened
Together, they provide complete observability into your context engineering effectiveness.
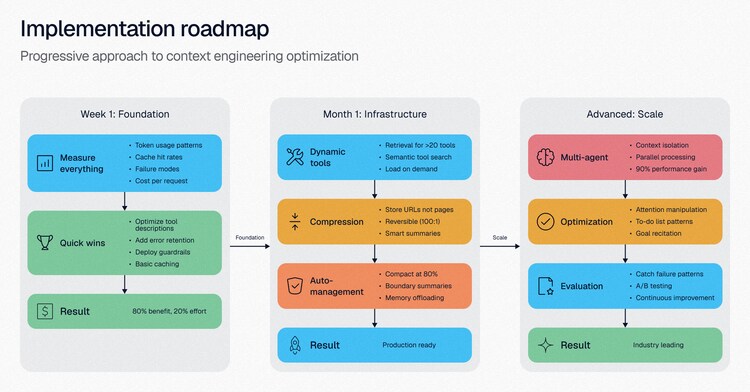
How to get started: From debugging to reliable agent systems
Mastering context engineering is not a one-time project; it is an iterative commitment to observability and intentional design. Whether you are using frontier models or specialized open-source alternatives, your context strategy is the defining factor in whether your agent becomes a reliable business asset or a source of technical debt.
You now have a complete lifecycle for building reliable agents:
- Diagnose issues using Failure Modes
- Architect your solutions with the five core design patterns,
- Maintain performance through the continuous Observability Loop
The fundamental principle remains: every token in your context influences the response. Make them earn their place. By profiling your failures, applying architectural patterns incrementally, and maintaining a rigorous feedback loop, you stop treating context as an infinite junk drawer and start treating it as what it truly is—the core operating system of your agent.
Understanding your agents at work is key to trusting AI systems. Learn about Splunk Agent Observability and get hands-on with the Splunk Observability Cloud Free Edition today.
FAQs
Related Articles

Exploit Prediction Scoring System (EPSS): How It Works and Why It Matters

Vendor Management: The Complete Guide