Splunk at the Service of Medical Staff
*Disclaimer: Neither the author nor Splunk LLC claims that Splunk is a medical software or clinical application for actual patient diagnosis or clinical decision support. Splunk does not interpret actual diagnosis of patients nor replace FDA approved, or other regulatory authorities, AI configured medical devices. Any clinical observations should be noted directly in an approved and authorised system of record. The following use case is meant to show an example of how Splunk can be an integrated clinical messaging system to assist with order communications/results retrieval (OC/RR).
Given the current circumstances and the pressure medical staff and hospitals are facing in general, access to information is now more critical than ever. Optimising the process of medical exams and enabling alerts and notifications in real-time has become essential. Moreover, it’s crucial to supplement methods of treatments with information gathered through machine learning and to ensure accessibility and mobility of the most vital data via an ergonomic and fast interface.
I recently had the opportunity to work on an extraordinary use case for a large French hospital center, all thanks to Splunker Anthony Costeseque who made it possible. In this article, I would like to share more details on this exciting project.

The Genesis of This Project
The integration of artificial intelligence and machine learning has proved satisfactory in facilitating diagnoses during medical examinations.
Our project’s main challenge was to provide a tool that makes it possible to centralize and monitor all patient data, their examinations as well as the results of AI treatments. We also wanted to deliver a dashboard that was easy and intuitive enough to use, not only to access the information but also to process it in real-time.
What Role Does Splunk Play in all of This?
How could we possibly not think about Splunk when talking about centralisation of all data, not to mention monitoring and dashboarding? After all, Splunk is a versatile platform that isn’t limited to traditional sectors such as cybersecurity or IT.
Last year’s introduction of new dashboarding frameworks unlocked endless possibilities for data retrieval and the creation of dashboards.
This tool’s intuitive, easy-to-use and powerful editor facilitates data storytelling, the process of translating complex data insight into a narrative.
It is also a real framework that makes the creation of front-end development environments around Splunk dashboards much easier. As it was developed with React, a modern and popular framework, it offers the possibility to integrate any component that is compatible with its library.
Let’s Get Down to Business!
Medical image processing used to be long-winded (several hours on average). In a scenario when every second counts it is crucial that doctors get the results as soon as possible. The proposed architecture is quite classic: Data generated by the machine learning algorithms in other medical equipment and image sections are combined and dropped into an indexed folder within the Splunk platform.

A notification then gets sent to the appropriate medical staff in real-time: a significant time-saving!
One challenge faced was to provide an ergonomic interface to display the image sections and the associated data when trying to visualise the results. I spent hours looking for a suitable React-component to integrate with the dashboard. The best candidate turned out to be the React Image Gallery, which was seamlessly integrated after a few modifications.
Enough said - here is the dashboard in action:

The Cherry on Top
Before making their diagnosis, doctors are able to interact with the results, marking observations and looking at the history of added comments.

This allows the doctor to:
- be alerted in real-time as soon as the results are available
- display all data and image sections on any device: a workstation with Splunk, a smartphone or tablet with Splunk Mobile or even a TV with Splunk TV
- write and review observations
A big Thank you to Anthony Costeseque, who made it possible to bring this use case to life!
For More Detail on the Applied Tech:
- Presentation of the new dashboarding framework
- Source code for the application can be found here: https://bit.ly/2OOr1cX
- Development of React-applications for Splunk Enterprise and Splunk Cloud: Install the package via npm (https://www.npmjs.com/package/@splunk/dashboard-core) and try the examples here
Please don’t hesitate to get in touch with Anthony Costeseque or me if you have any questions, comments or suggestions regarding this project!
------------------------
Happy Splunking,
Atef Kouki
*This article has been translated from French. You can find the original blog post here.
Related Articles

Announcing the General Availability of Splunk POD: Unlock the Power of Your Data with Ease

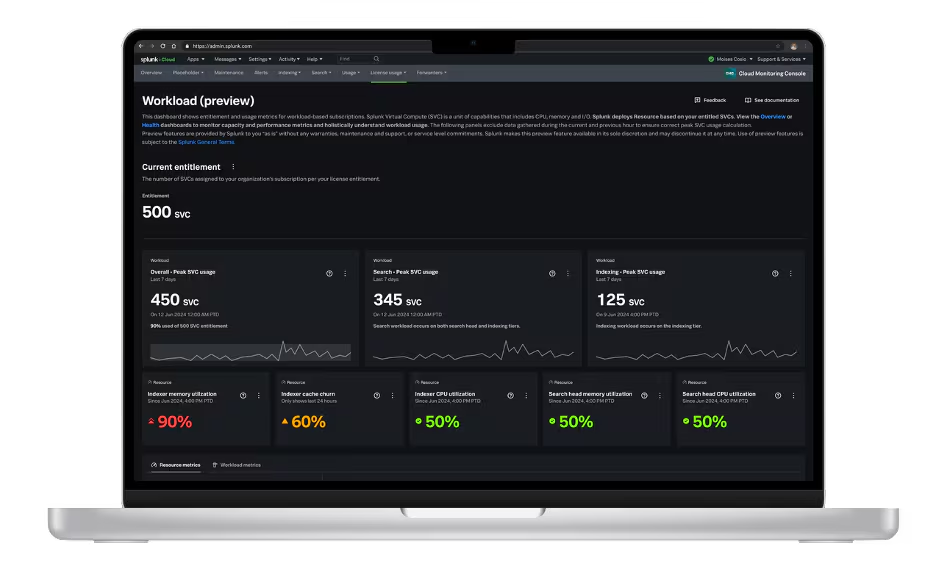
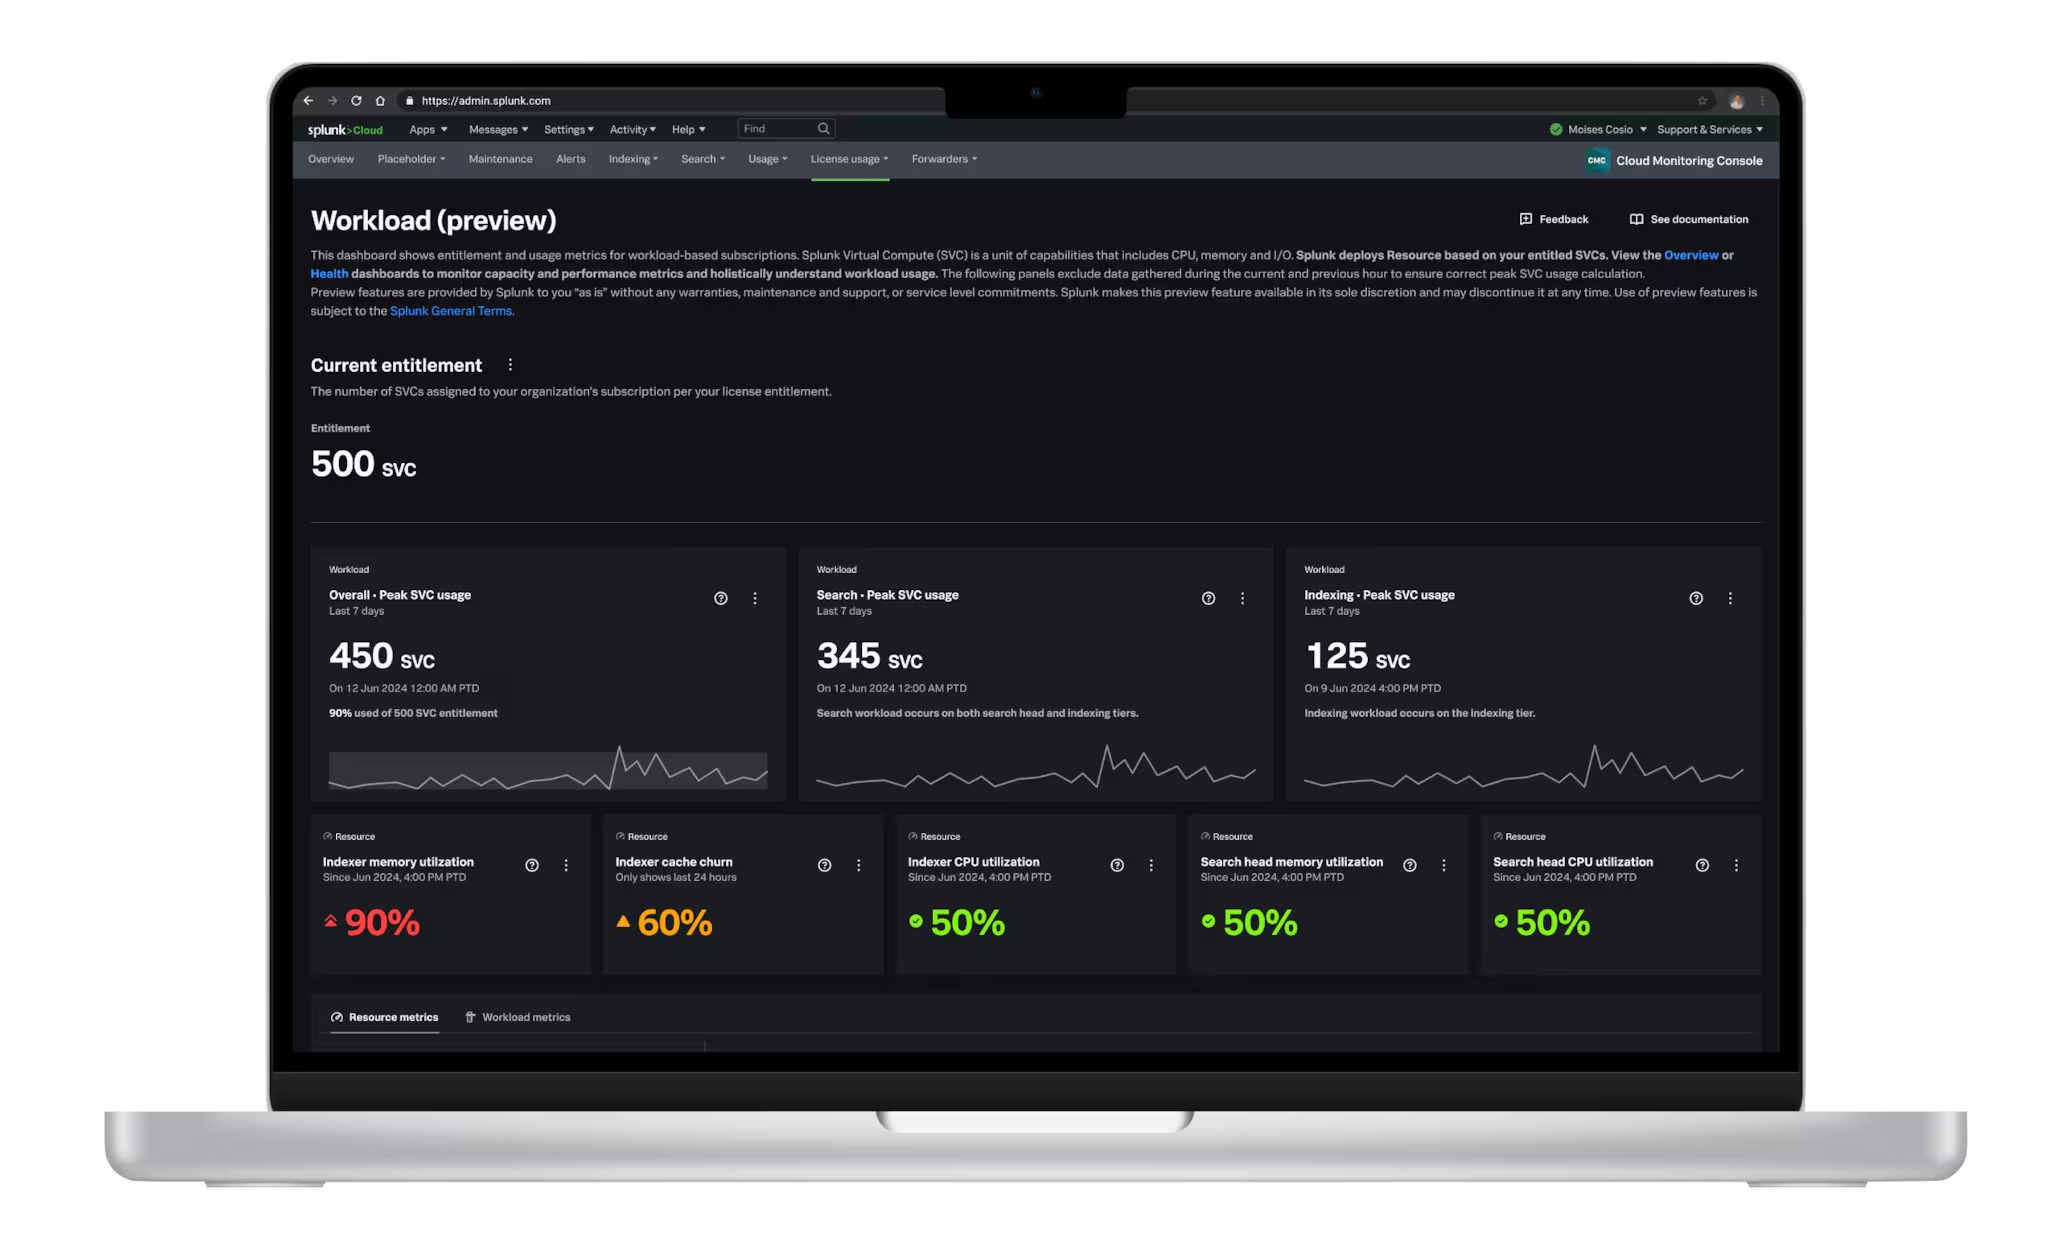
Introducing the New Workload Dashboard: Enhanced Visibility, Faster Troubleshooting, and Deeper Insights

Leading the Agentic AI Era: The Splunk Platform at Cisco Live APJ

Dashboard Studio: Token Eval and Conditional Panel Visibility

Introducing Resource Metrics: Elevate Your Insights with the New Workload Dashboard

Powering AI Innovation with Splunk: Meet the Cisco Data Fabric

Remote Upgrader for Windows Is Here: Simplifying Fleet-Wide Forwarder Upgrades

Dashboard Studio: Spec-TAB-ular Updates
