Dashboard Studio: More Maps & More Interactivity
In Splunk Cloud Platform 8.2.2203, we're continuing to expand on interactivity capabilities and visualizations for Dashboard Studio. We've added the ability to use search results and job metadata as tokens, and pass tokens through drilldowns to other dashboards. There is a new map visualization for cluster maps and UI to match strings for dynamic coloring. And finally, we've included the ability to set a Studio dashboard as your home dashboard.

Use Search Results or Search Job Metadata as Tokens
Since Dashboard Studio's inception, you have been able to set tokens using inputs. In Splunk Cloud Platform 8.2.2109, we introduced the ability to set tokens by clicking on visualizations. Now, we're adding a third way to set tokens: from search results or search job metadata!
This will unlock more use cases such as setting up default dashboard values on dashboard load, and dynamic text.

In order to enable a data source to use its results or metadata as token values, be sure to check the option in the data source configuration panel:

The syntax generally follows the format: $search name:job.<metadata>$. In the example above, in order to retrieve job status for my data source, "Activity by Sourcetype", I used the following token: $Activity by Sourcetype:job.status$. If I wanted to render my search results directly in my dashboard, I could use the syntax $search name:result.<fieldname>$ to render the first row of the specified field. In this scenario, I could use $Activity by Sourcetype:result.count$, which would render the first row of the 'count' field.
Pro tip: These tokens are case sensitive!
For a full list of the metadata you can use and proper syntax, check out our docs.
Drilldown to Other Dashboards (and Pass Tokens!)
We know that being able to drilldown to other dashboards and pass token values to maintain context is a key part of many workflows. In this release, we're introducing the ability to do just that. You can now set up a drilldown to "Link to Dashboard" and pass dynamic tokens (i.e. tokens values set by clicking on a visualization).

If the target dashboard has inputs with tokens, you'll see a list of the token names when configuring the dropdown. You can always manually specify the token name as well.
New Map for Bubble and Marker Maps
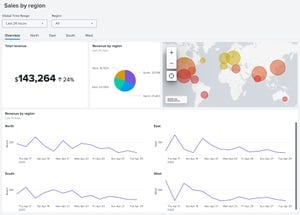
This release also comes with a new visualization: splunk.map which will enable you to display bubble and marker maps on the dashboard. This bubble map example uses the traditional geostats command.

You can also use a table command for map data, as shown in this marker map.

Match Strings for Dynamic Coloring
In addition to dynamic coloring based on numerical ranges, you can now apply dynamic coloring based on string or numeric matches.

You can find the string match UI in the Dynamic Coloring section of the configuration panel, under "Matches". This applies to all visualizations that support dynamic coloring: Single Value, Single Value Radial, Single Value Icon, Table, Choropleth SVG, Ellipse, Rectangle, and Sankey.
Set Studio Dashboards as Your Home Dashboard
We regularly review Splunk Ideas and add those requests to our backlog. One of the most recent examples of this is the idea to set Studio dashboards as home dashboards. And now you can do so! You can select a Studio dashboard for you home dashboard in three places:
From the home page

From the dashboard listing page

From the Studio dashboard

Coming Soon
Check out Dashboard Studio and send in your feedback through Splunk Ideas, and you might see your feature request listed on a future blog's "coming soon" list! We are continuing to work on new capabilities, which are delivered incrementally with Splunk Cloud Platform and Splunk Enterprise releases.
- Conditional show/hide of dashboard panels
- Additional UI to configure visualizations
- More drilldown options
Helpful Resources
- Dashboard Studio Tutorial
- Dashboard Studio Tech Talk
- Splunk Dashboard Studio Documentation
- Splunk Ideas - Dashboard Studio for feature or enhancement Requests
- Examples Hub - Find the Examples Hub from the Dashboards page in Search & Reporting
- Splunk Community - Dashboards & Visualizations for questions
* This information is subject to change at any time, at the sole discretion of Splunk LLC and without notice. This roadmap information shall not be incorporated into any contract or other commitment. Splunk undertakes no obligation to either develop or deliver any product, features, or functionality described here.
Related Articles

Announcing the General Availability of Splunk POD: Unlock the Power of Your Data with Ease

Introducing the New Workload Dashboard: Enhanced Visibility, Faster Troubleshooting, and Deeper Insights

Leading the Agentic AI Era: The Splunk Platform at Cisco Live APJ

Dashboard Studio: Token Eval and Conditional Panel Visibility

Introducing Resource Metrics: Elevate Your Insights with the New Workload Dashboard

Powering AI Innovation with Splunk: Meet the Cisco Data Fabric

Remote Upgrader for Windows Is Here: Simplifying Fleet-Wide Forwarder Upgrades

Dashboard Studio: Spec-TAB-ular Updates
