Analyzing BotNets with Suricata & Machine Learning
Platform SplunkSince the official rollout at the year’s. conf of the Machine Learning Toolkit(MLTK), Splunkers have been pursing some interesting use cases ranging from IT operations, planning, security and business analytics. Those use cases barely scratch the surface of what is possible with machine learning and Splunk. As an example, I will use the machine learning toolkit and data collected from Suricata to analyze botnet populations. This population analysis will be used to create a model for predicting the Mirai botnet based on network features.
Suricata
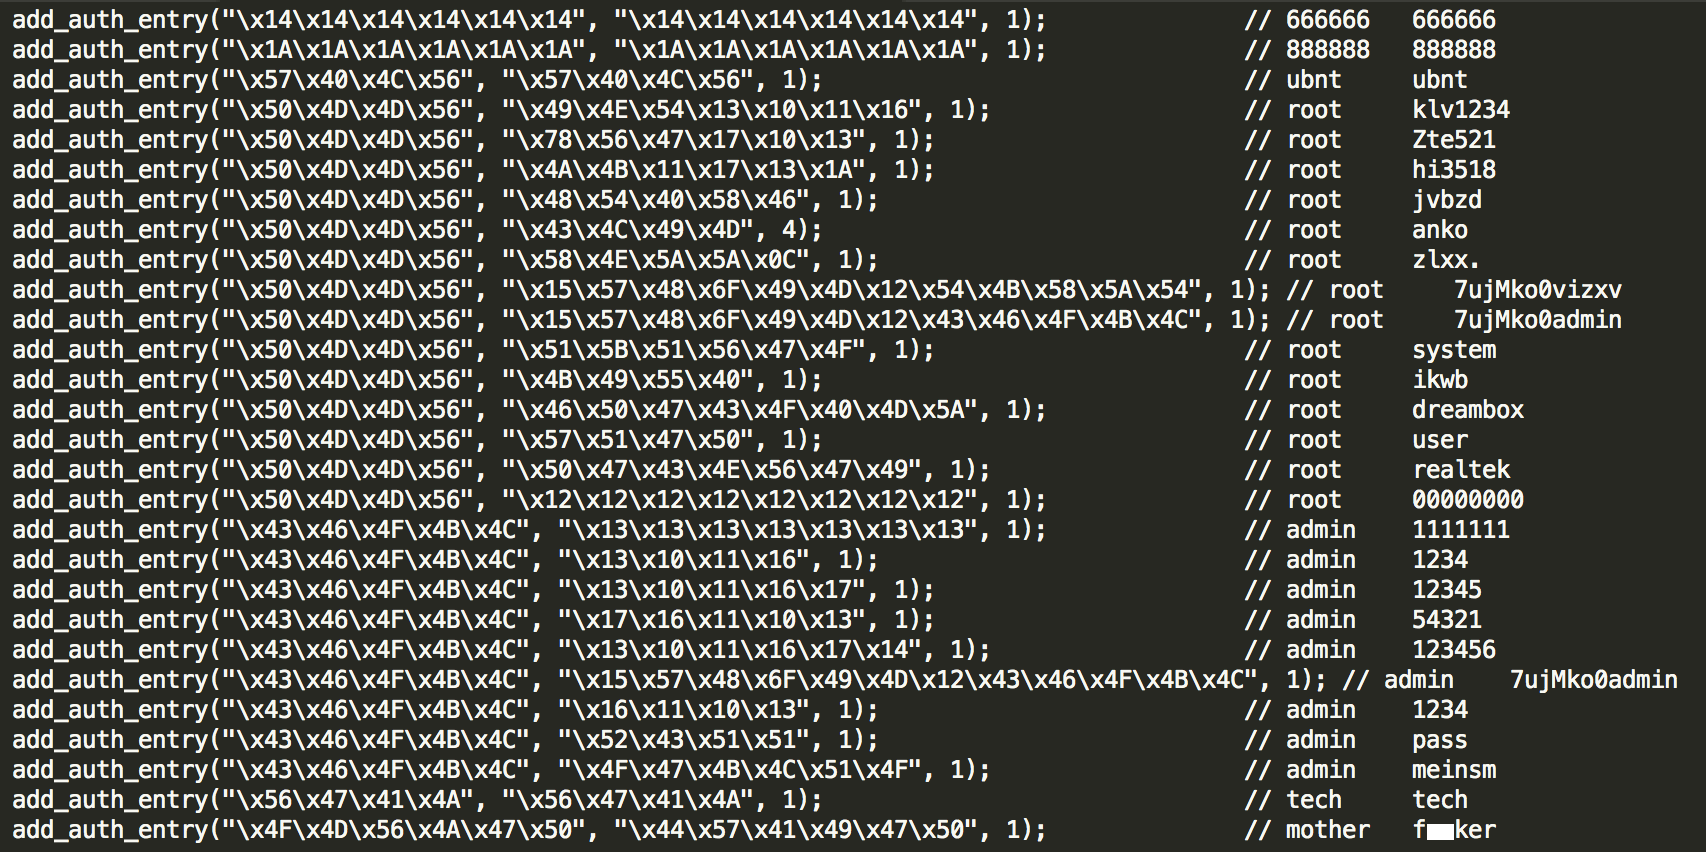
Suricata is an open source threat detection engine, which can be run in passive mode for intrusion detection or inline for intrusion prevention. My lab environment is configured for intrusion detection, meaning Suricata will not make any attempt to prevent an intruder from accessing my system. This is a “good” thing because the behavioral signature of Mirai (and variants) use specific usernames for IoT devices found in the scanner.c module in the sshd logs & telnet sessions of the server it attempts to infect.
Analysis
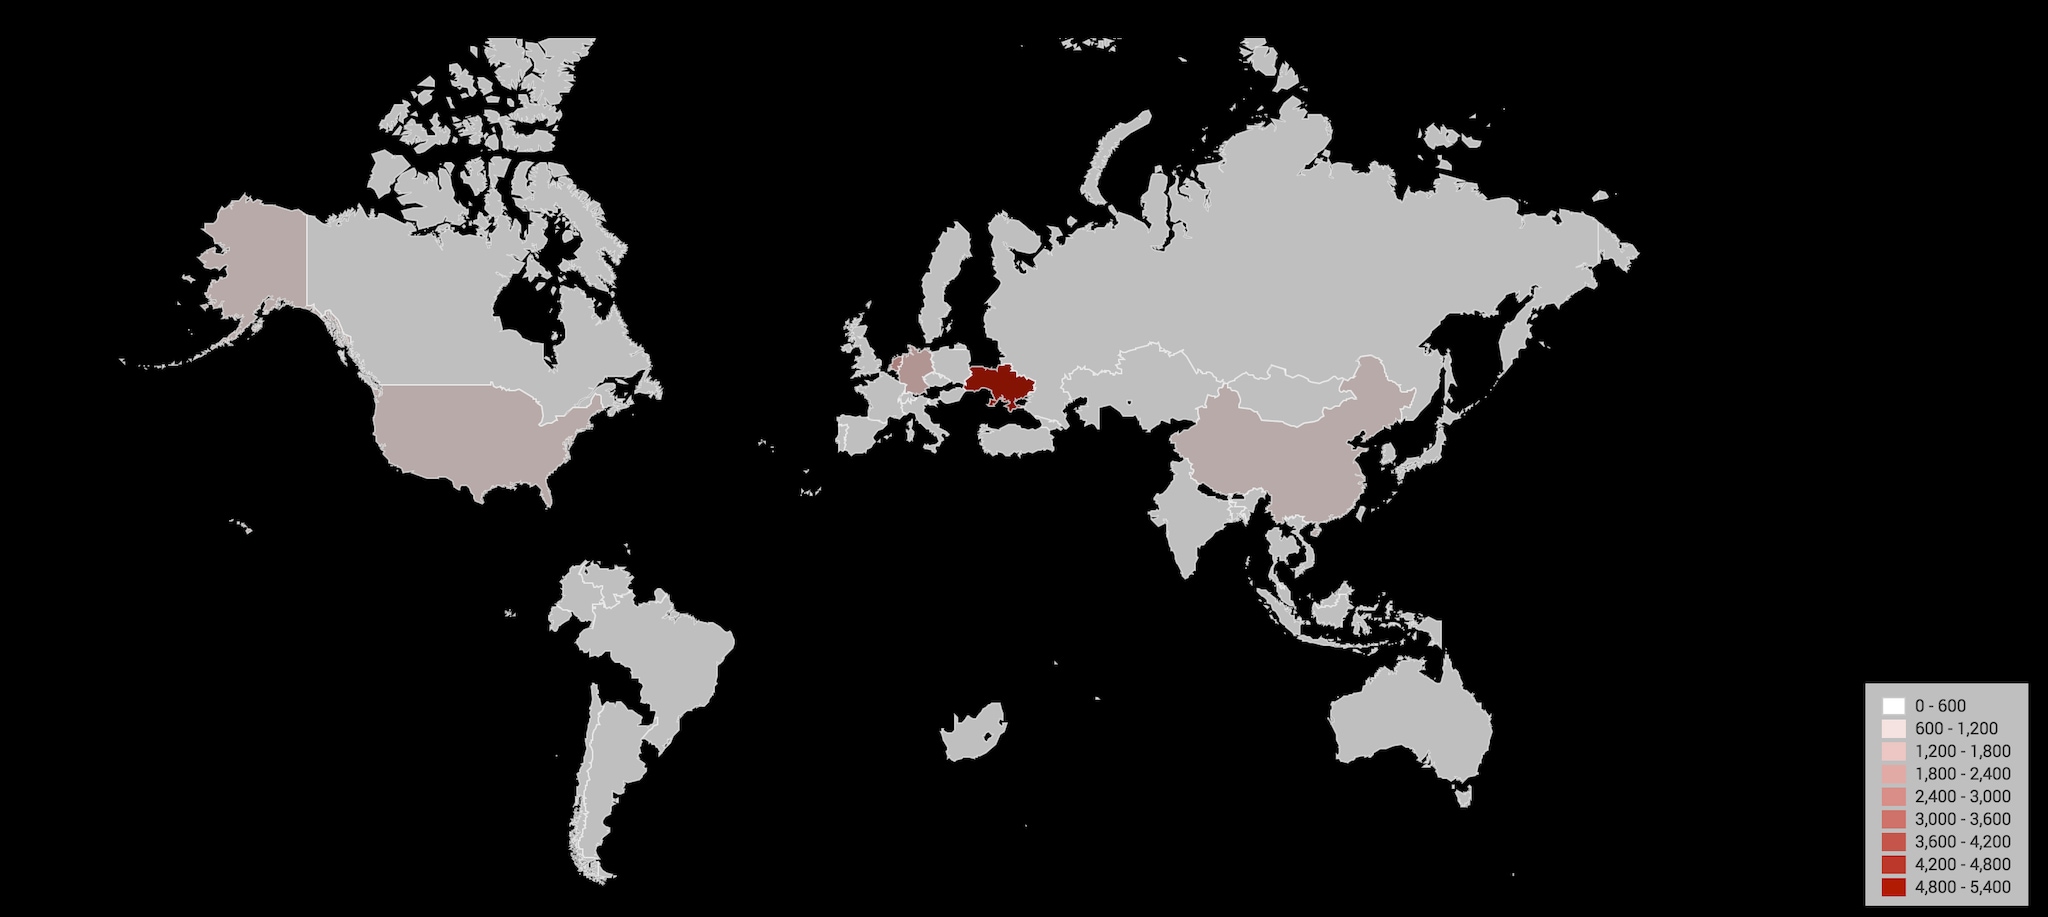
The analysis largely builds upon the previous blog post (Analyzing the Mirai Botnet with Splunk), which correlated the failed logins of specific usernames and ip addresses. This threatlist of suspected Mirai ip addresses can be analyzed for various features such as geography, IANA registration, frequency, etc…
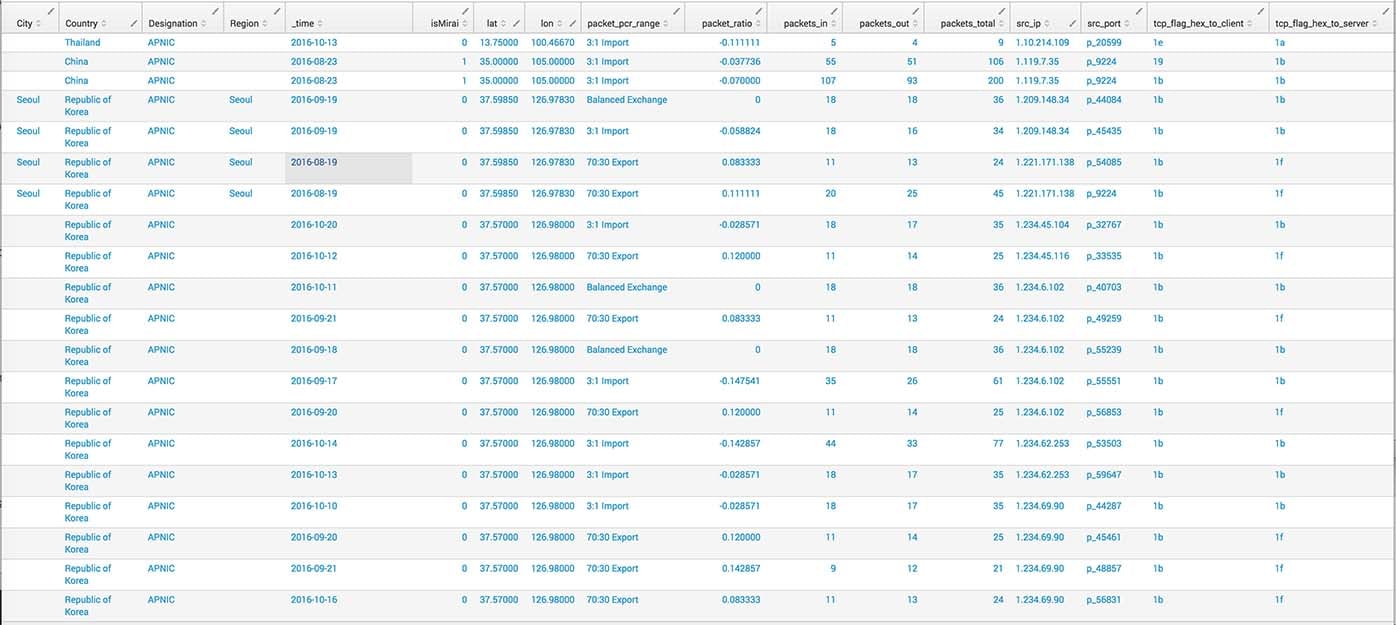
Combining this threatlist with our passive intrusion detection netflow data creates an enriched dataset for building a model. Adding, contextual and detailed information about each access attempt at the packet level provides insights into the activity attempted by that IP or block of IPs during a 24 hour window. As an example, we can determine which tcp flags were present in the packets both client side & server side in each flow transaction and begin grouping similar events together. We can also create a ratio of packets_in v. packets_out and classify these flows into various producer consumer ratio(PCR) categories.
MLTK
The MLTK is handy because of the many assistants which ship with the tool, you don’t need to know the exact SPL syntax to begin making use of it. Using the clustering assistant, I can attempt to discern different botnet populations based on the features present in my dataset. In the below example, I have selected 50k random Suricata flow events, where the dest_port is 22. I have picked features which have some relation to each other, but are enriched by the PCR metric. I have created a label of isMirai with possible values of 0 | 1, depending on the IP address associated with that flow event. I have opted for Kmeans clustering with a value of k=5.

Interestingly, a clear visual pattern emerges with cluster_4. It is clearly an outlier compared to the rest of the population, but is there anything special about it? From an isMirai 0 | 1, perspective there is a mixture of both 1’s and 0’s. The packet_pcr_range, is 3:1 Import, with varying ratios, which seems to be the only common feature of cluster_4.

Using a model for prediction
MLTK isn’t intended to create models for the sake of creating models, it also allows you to operationalize those models for predicting based on features found in the model, one such feature we get from kmeans is the cluster_distance. This number describes the distance an event is from the centroid.
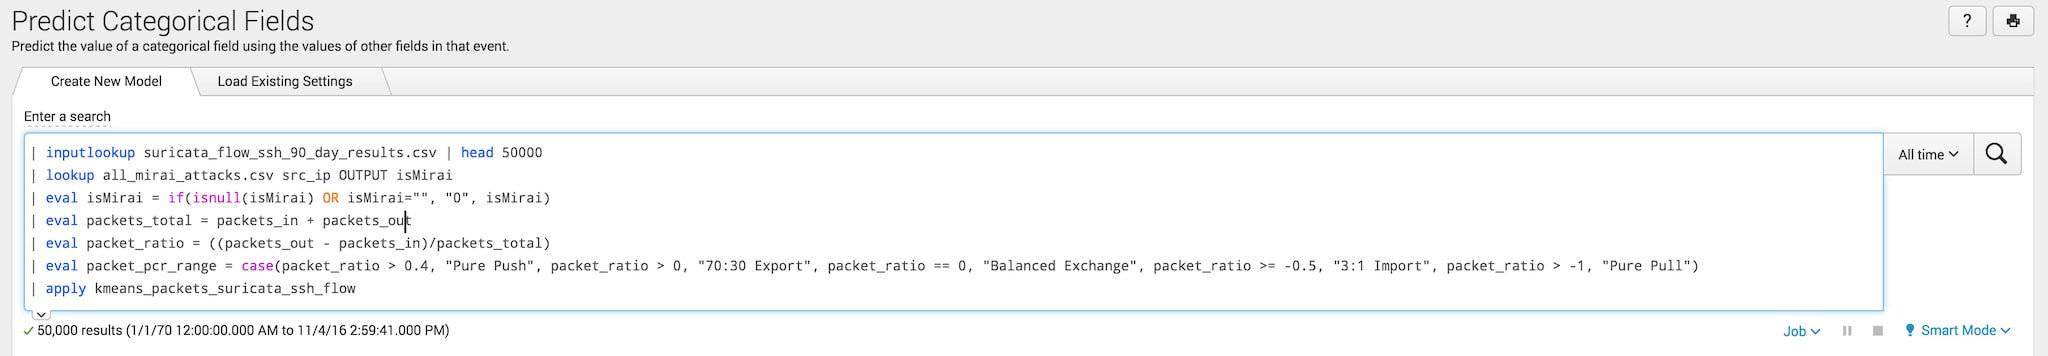
Using the prediction assistant, the Kmeans model can be loaded in search before selecting features from the dropdown to use for prediction. We can then select the features we wish to use for prediction: cluster_distance, packet_pcr_range, packet_ratio, and packet_total. The prediction assistant also gives you the ability to adjust the specific algorithm to use for prediction, I have opted for Random Forest.

Next Steps
The model appears to be very good at predicting 0 (not Mirai), while it is reasonably good at predicting 1 (89.4%). This is an improvement over Suricata, which did not detect Mirai with the emerging threats ruleset. This may imply that there is an indicator of compromise for the Mirai botnet at the packet level. Proof of this requires further investigation, and independent validation to understand why the model can predict Mirai so effectively to eliminate bias or mistakes. Collaboration with others who have also gathered traffic from botnets is a great way to validate the model against a data set it has not seen before to further validate. If an indicator of compromise can be discerned from this analysis it could be converted into an IDS signature for future detection of Mirai infection attempts.

----------------------------------------------------
Thanks!
Anthony Tellez
Related Articles

Announcing the End-of-Sale of Splunk Light

Driving Data Innovation With MLTK v5.3