Analyze Metric and Event Data on the Same Platform
Analyze both metric and event data on the same platform regardless of source or structure. With Splunk metric indexes, you can quickly and easily ingest, store, and analyze metrics — whether in the Analytics Workspace or with SPL — so you can deliver positive business results. Get the most value out of your data with Splunk.
Why Bring Metrics into Splunk?
While Splunk is the industry leader for storing and retrieving log data, did you know that you now also can store and search metrics data in Splunk as well?
A log is an event that happened and a metric is a measurement of the health of a system. Splunk now offers metric indexes. The introduction of metric indexes in addition to traditional indexes allows users to efficiently store and search both events and metrics data in Splunk. Keeping your metrics data in the Splunk metric indexes uses less storage space than events, and increases query search speed 500 times, using less system resources at a lower licensing cost.
How to Create a Metric Index
Creating a metric index is as easy as toggling the data type while you create your new index. There are multiple ways to bring metrics into your new metrics index — you can bring data in directly as metrics or convert your already ingested event data into metrics for faster analysis in Splunk:
- To bring data in directly as metrics, Splunk recognizes the StatsD and collectd formats out of the box. You can also use the HTTP Event Collector (HEC) to send data from any other collector agents or get your data in CSV or JSON formats.
- For metrics that are hidden in logs or other kinds of event data, try the powerful logs-to-metrics workflow to pull metrics out of your logs and ingest them into your Splunk metrics indexes.
- To convert your existing event data into structured metrics, use the mcollect command. It transforms your events into metrics at search time and sends the results to your metric indexes. This allows you to take advantage of faster query performance on this data and makes it accessible to more audiences.
Query Your Metrics Easily

Use the Analytics Workspace to quickly browse and visualize your metrics data with different types of charts. Apply filters, dimension splits, and aggregations to gain insights into your data. Create reports, alerts, and dashboard panels without using SPL. The Splunk Analytics Workspace helps you to quickly identify and respond to any issues or anomalies in your data.
If you prefer to search your data using SPL, you can access and analyze your data with the Search and Reporting app using metrics-specific commands like mstats and mcatalog.
Alert on Your Metrics
Once you start tracking your metrics, you can monitor them and set up a Splunk alert to find out you are in or out of your target range.
Whether you use the Analytics Workspace or SPL to analyze your metrics data, you can easily create a new type of streaming metric alert to stay informed on your health. Streaming alerts are more efficient than traditional scheduled alerts and can scale up to tens of thousands of alerts.
Keep Your Metrics Handy for Future Reference
After a year of tracking your metric regularly, you may want to zoom out and see your monthly or yearly average and store your summaries for future reference. This is where metric rollups become useful. Splunk lets you define metric roll ups that summarize your metric data into indexes that are optimized for long-term storage and review.
You can create different time frame based rollups of your data and take advantage of faster query time using these rolled-up indexes.
So What?
Splunk’s underlying technology powers the ability to analyze both metrics and event data in the same platform. No matter your data source or structure, you can get the most value from your data, and invest in only one tool to do it — with Splunk. Try a free trial of Splunk Enterprise or Splunk Cloud to see for yourself.
To learn more about self service analytics capabilities at Splunk and see a hands-on demo of the Analytics Workspace discussed in this blog, join us for the Splunk Self Service Analytics Tech Talk Webinar.
Related Articles
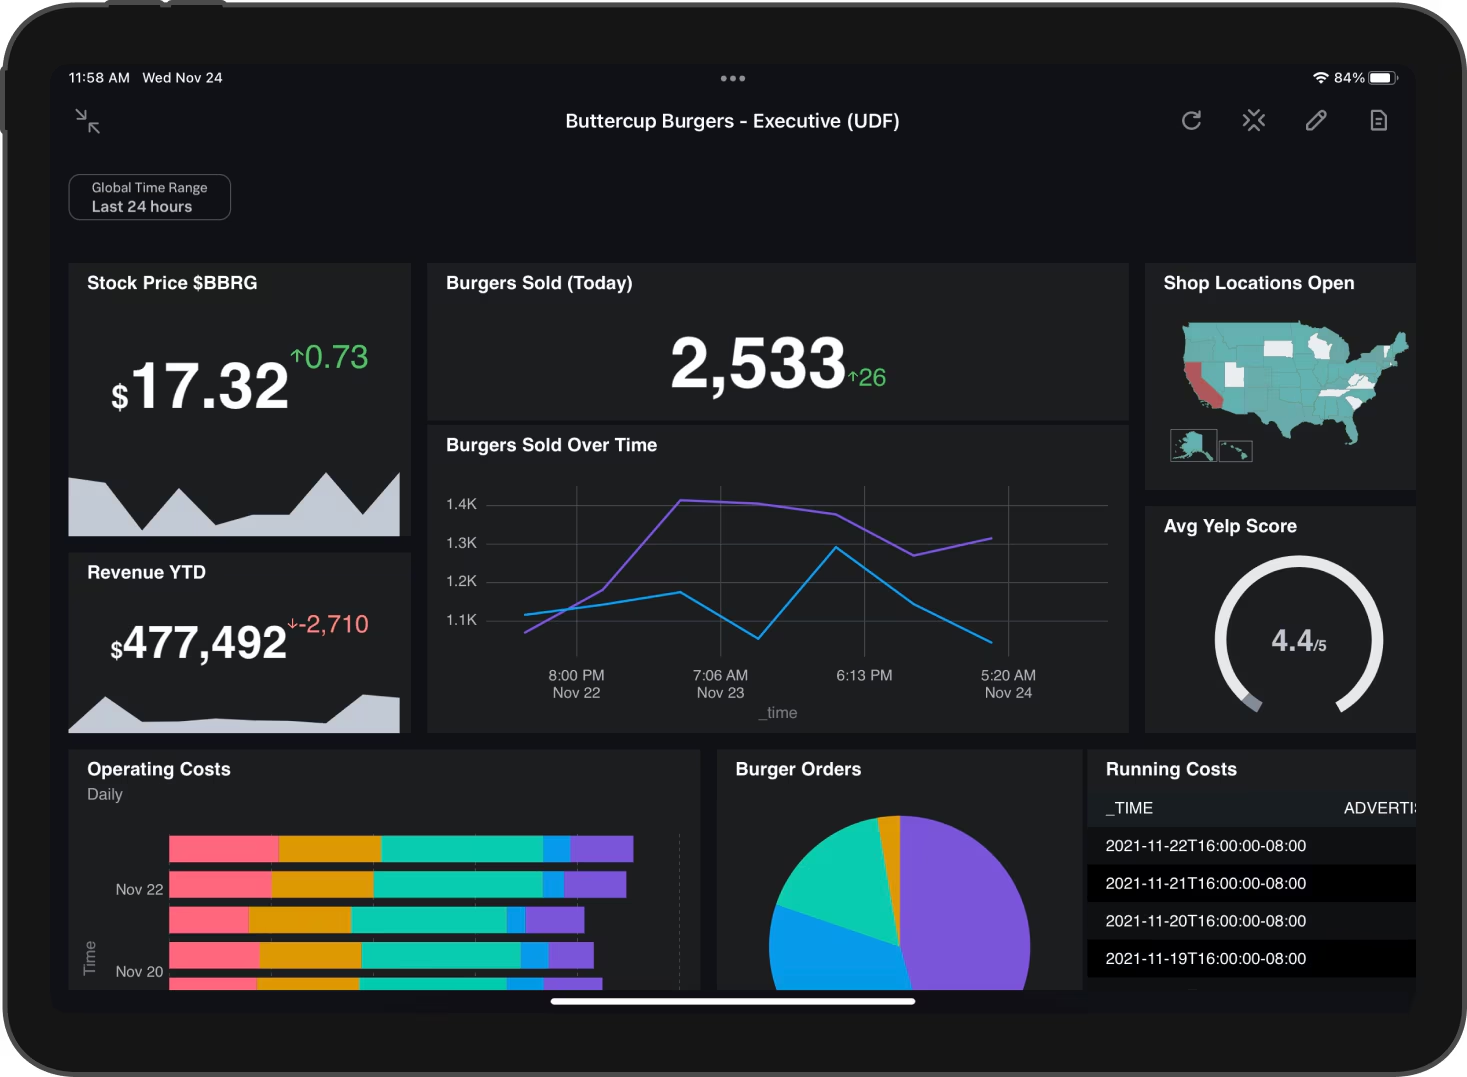
Introducing… Splunk for iPad!
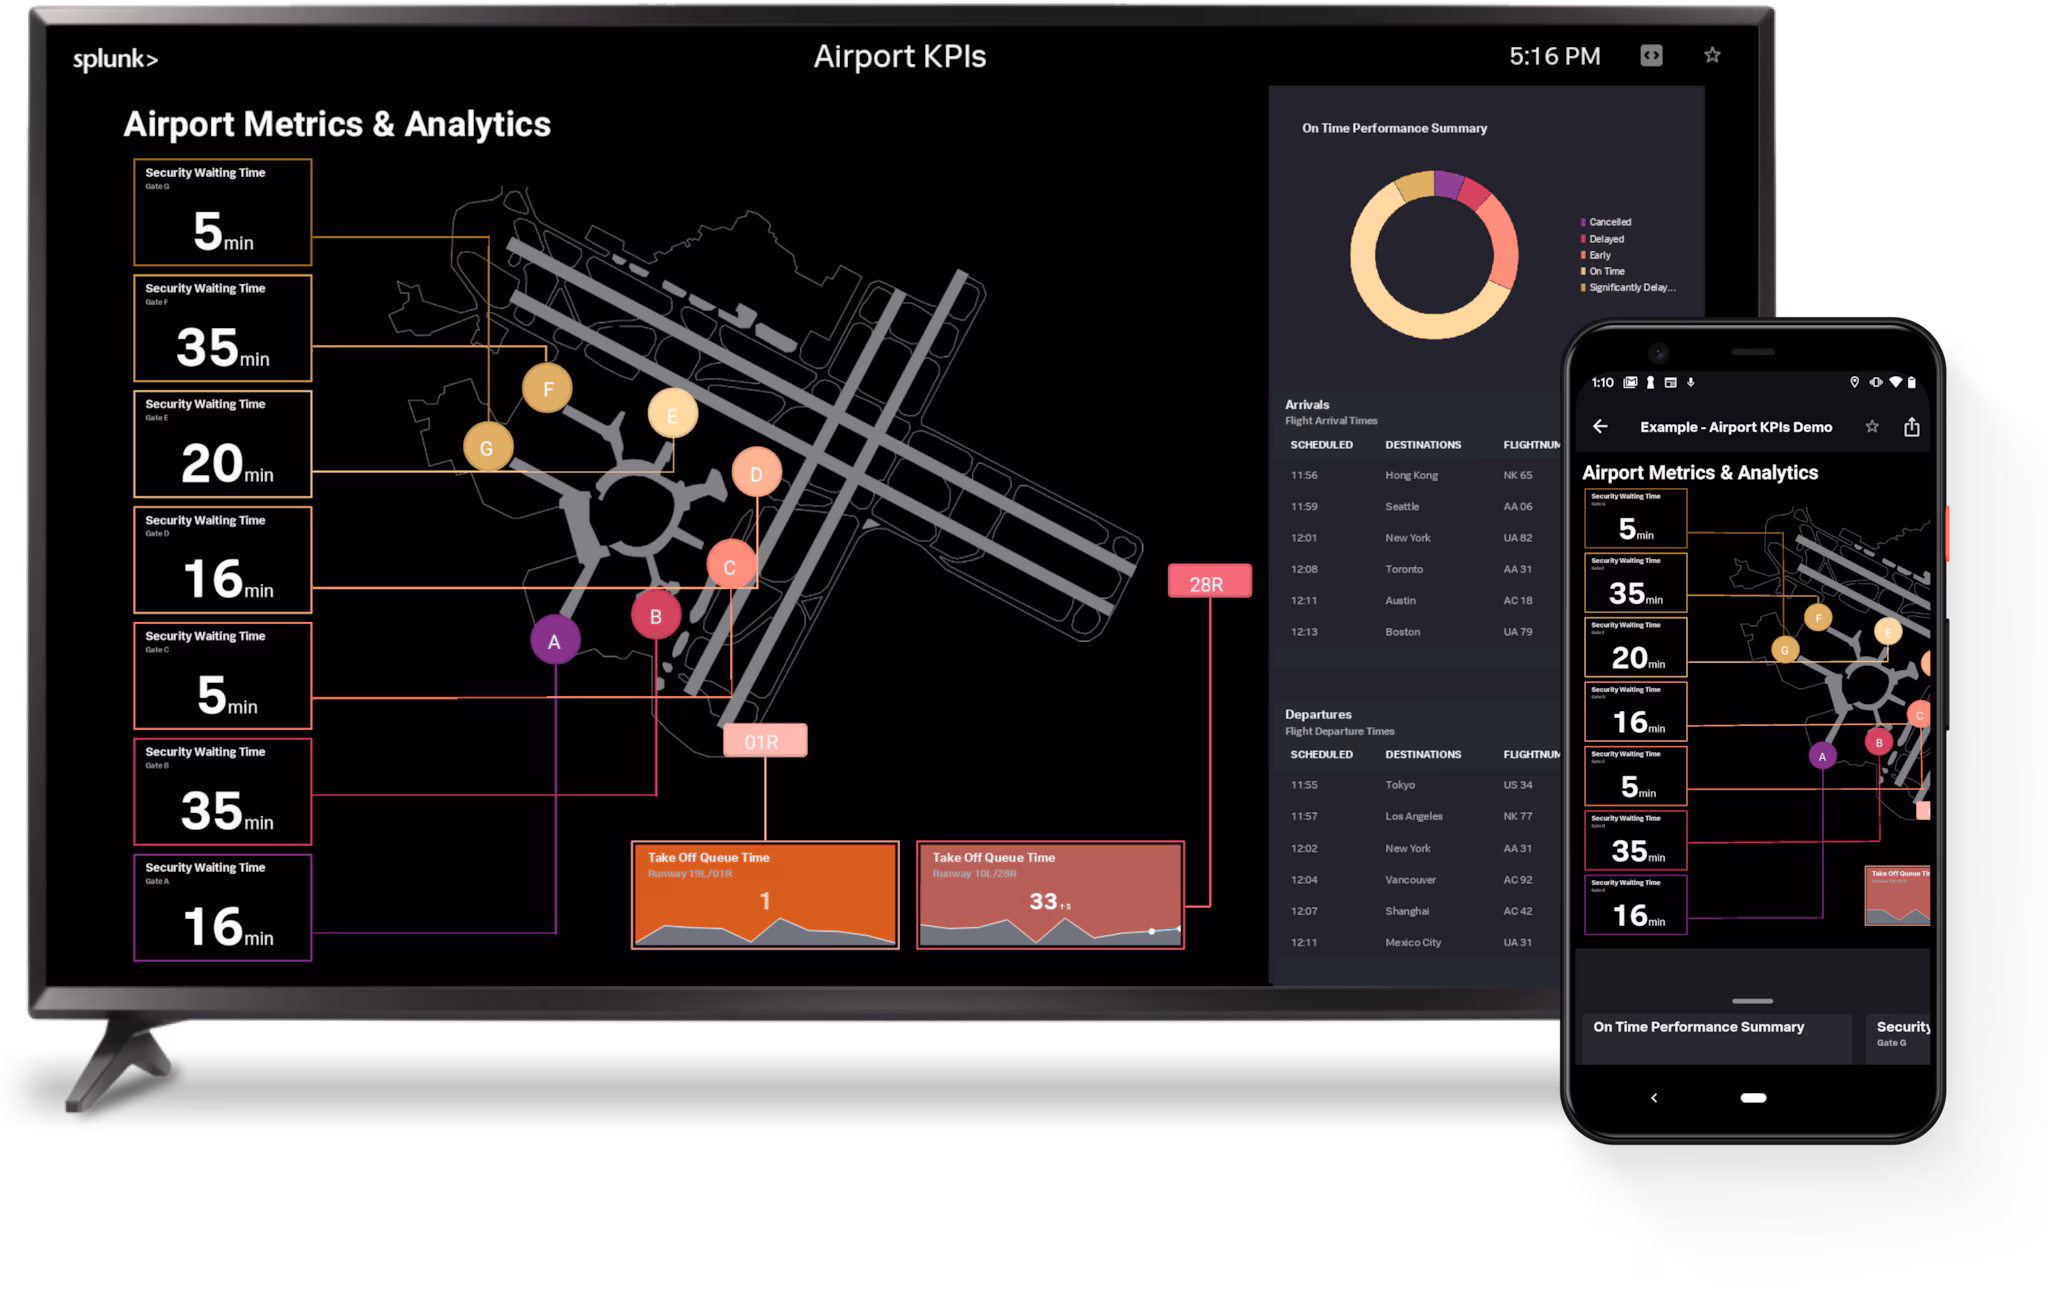
Dashboard Studio on the Go
Logging into your Connected Experiences

Splunking Your *.conf Files: How to Track Configuration Changes Like a Boss
Get Started with Connected Experiences

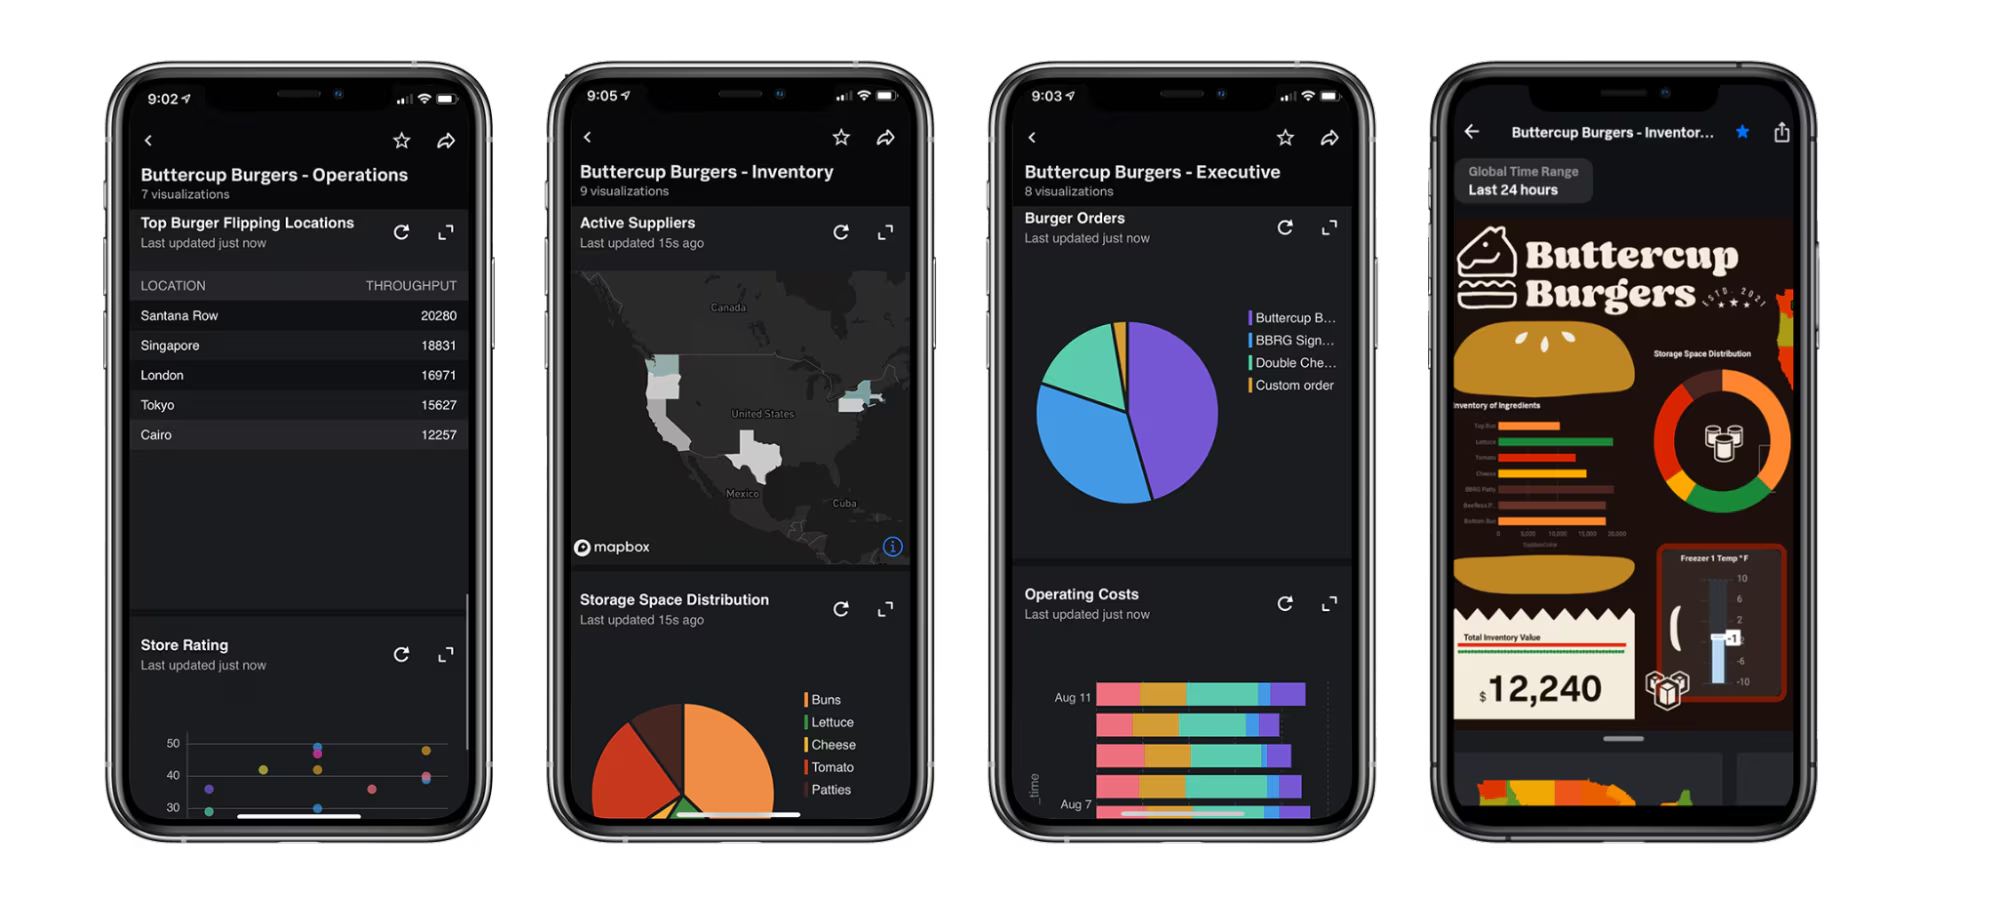
Unlock Value from Your Data Anywhere: Connected Experiences .conf21 Highlights
Dashboard Studio: New Features Highlighted At .conf21