Observability Blogs
Latest Articles
template
category
category
observability
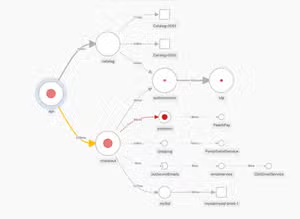
How to Improve Business KPIs with Splunk APM Business Workflows
Splunk APM Business Workflows helps DevOps teams connect application performance to business KPIs and provides leaders with real-time visibility of important business metrics.

Three Keys to Unlocking the Power of Modern IT Infrastructure
Countless “data heroes” turning to data for insights, nuance and truth are the reason the world has been able to vault forward in an unprecedented digital transformation. As organizations rely more heavily on data and data teams to deliver on the promise of digital transformation and the cloud, it will be increasingly important to build an interconnected IT infrastructure.

Observability and Monitoring for Modern Applications
Splunk is committed to helping developers and IT professionals address these problems with a set of fully integrated solutions built for modern monitoring challenges and for laying the foundation for an interconnected, cloud-native enterprise.

Hyperledger Besu is an Observability Pioneer
Hyperledger Besu is a Java-based, enterprise-ready, mainnet-compatible Ethereum client hosted by the Hyperledger Foundation, and now Hyperledger Besu integrates with the OpenTelemetry project to deliver real-time, actionable insights into your Ethereum client performance.

Introducing Splunk OpenTelemetry Java Lambda Wrapper
Introducing Splunk OpenTelemetry Java Lambda Wrapper. In this blog, we’ll show you how to deploy the wrapper with a Lambda layer for frictionless instrumentation
The OpenTelemetry Tracing Specification Reaches 1.0.0!
OpenTelemetry tracing specifications reached 1.0.0; which means tracing APIs and SDKs GA is imminent! Read more about this exciting announcement in this blog.
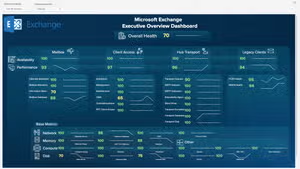
Getting the Most Out of Microsoft Exchange and Splunk ITSI
The Splunk IT Service Intelligence (ITSI) Content Pack for Microsoft Exchange provides a “quick start” out-of-the-box solution that delivers fast results and maximizes the value realized from ITSI. The content pack gives you depth and breadth of visibility across your Microsoft Exchange environments.

AWS Distro for OpenTelemetry — Now with Splunk Observability Support!
Today, we are excited to announce the release of the AWS Distro for OpenTelemetry with full Splunk Observability support! The AWS Distro for OpenTelemetry allows customers to capture metadata from AWS resources and managed services to correlate application performance data with underlying infrastructure data.

Observability with CI/CD in a Developer World
You need to monitor your apps and deploys equally. The Splunk Observability portfolio is the perfect complement to a CI/CD approach, from a developer laptop to an integration test environment.