Observability Blogs
Latest Articles
template
category
category
observability

Azure DevOps: Fun with Observability Events and Alerts!
With Splunk Observability Integrations for Azure DevOps you can visualize your pipeline runs, releases, and protect yourself from errant releases during major events or service outages.

Splunk Developer Winter 2022 Update
What’s the latest from Splunk Developer? Check out our latest winter updates including new Splunkbase preview, easier private app installation in Splunk Cloud Platform, Python SDK updates, more new AppInspect checks, updates on being ready for future Splunk releases and much more.
Deep Dive into the App Start Experience
Developer blog on App Startup Service Level Indicators (SLIs) written by the Splunk mobile team.

Leverage contact center monitoring for world-class customer experiences
When a customer support call goes well, life is good. With Cisco UCCE and AppDynamics, every support call can be a great customer experience.
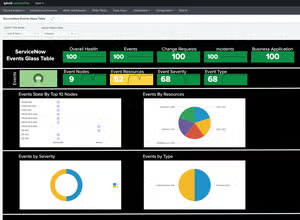
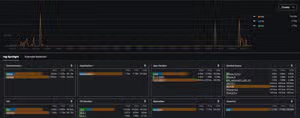
ServiceNow Is Available in Splunk Enterprise!
The new Splunk Content Pack for ServiceNow brings in key data such as: events, change requests, incidents, and business applications from all of your ServiceNow instances into Splunk, and makes it all easily visible and available, so that you can make informed business decisions.

Optimizing Mobile App Startup with Splunk Real User Monitoring
Using Splunk Real User Monitoring on Splunk mobile apps to provide a better end-user experience.
IT Service Intelligence (ITSI) Comes to Splunk Mobile and TV
Check out the latest Splunk IT Service Intelligence updates on Splunk Mobile and Splunk TV!

Splunk Remains the Leader in APM and Observability — GigaOm Report Confirms It
We're extremely proud that in its inaugural report, GigaOm Radar for Application Performance Monitoring (APM) Report, 2021*, Splunk was named a Leader and one of only two Fast Movers.

NEW: Splunk Synthetic Monitoring Adds Single Sign-On (SSO) and Security Improvements
Splunk Synthetic Monitoring adds support for Single Sign On (SSO) via SAML 2.0, Concealed Global Variables, and an updated synthetic browser version (Chrome 97), to improve security, compliance, and ease-of-use for IT Ops and engineering teams in enterprise environments.