Observability Blogs
Latest Articles
template
category
category
observability

A Deep Dive Into Built-In Anomaly Detection: How the Algorithm Works
Discover how Built-in Alert Conditions and Alert Preview in Splunk Infrastructure Monitoring allow cloud operations to exploit the full power of our real-time analytics engine in a way that is both intuitive and flexible.

Monitor Microsoft Azure Functions in Real-Time
Discover how we've extended our Splunk Infrastructure Monitoring analytics capabilities to our Microsoft Azure customers so they too can monitor their functions in real-time.

Monitoring Amazon RDS with Splunk Infrastructure Monitoring
Amazon’s Relational Database Service (RDS) is one of the most popular database services in the world, used by 47% of companies on AWS according to 2nd Watch’s 2015 AWS Scorecard. In part one of this blog series, I described the top 10 challenges of monitoring Amazon RDS when dealing with larger scale production...

10 Top Things to Monitor in Amazon RDS
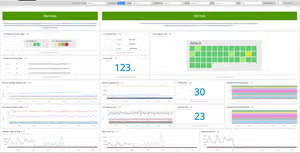
Splunk Infrastructure Monitoring offers a dashboard out of the box that shows you the most important RDS metrics at a glance.

How We Monitor and Run Kafka at Scale
Learn from our experience with Kafka at scale: what to monitor and alert on, troubleshooting, and capacity planning. Splunk Infrastructure Monitoring offers a dashboard out of the box that shows you the most important Kafka metrics at a glance.
Monitoring Red Hat OpenShift with Splunk Infrastructure Monitoring
Red Hat OpenShift presents an increasingly popular option for developers and operations teams who want to easily build and deploy application containers on Kubernetes. What follows is a brief overview of Red Hat OpenShift, why Splunk Infrastructure Monitoring is particularly suited for monitoring OpenShift and Kubernetes environments...

Metrics from Prometheus Exporters Are Now Available with the Splunk Smart Agent
Get an overview of the integration between Splunk Infrastructure Monitoring and Prometheus, a few technical details, and tips on how you can get started immediately.
Splunk Ranked No. 1 in Gartner’s Market Share for Performance Analysis
Splunk is ranked No. 1 in Gartner’s Market Share: Enterprise Infrastructure Software, Worldwide, 2019 for Performance Analysis: AIOps, ITIM and Other Monitoring Tools category
![Getting Started with Citrix in Splunk - [Part 1]](https://www.splunk.com/content/dam/splunk-blogs/images/media_19eaeb6da259811ed55e1c4bf408fd05ddb103b37/getting-started-with-citrix-in-splunk-part-1.webp?width=300&format=webp&optimize=medium)
Getting Started with Citrix in Splunk - [Part 1]
In this blog we are going to focus on getting Citrix-Data into Splunk - On-Prem/Private Cloud.