What Is AI Agent Observability? A Practitioner Guide
Learn Jackson WellsKey takeaways
- AI agent observability answers "was the agent right?", not only "did it run?" It joins session, trace and span data with evals that grade quality, safety and cost at every step.
- The practice rests on 4 signals: traces, evals, cost and guardrail decisions. Drop evals and a wrong tool call that returns HTTP 200 looks healthy on every dashboard.
- Sampling is the usual blind spot. Teams using a frontier judge often grade only 1 to 5% of traffic. Purpose-built small evaluator models cost up to 98% less than LLM-as-judge, which makes grading every interaction affordable.
An HTTP 200 used to mean the request worked. For an AI agent, it means the request finished.
That gap is where agents fail. An agent can pick the wrong tool, pass a stale order ID into a refund call, or run the same search over and over, and every span still reports success inside its latency budget. Latency, error rate and uptime describe the service. They don't describe the decision.
AI agent observability closes that gap. This guide defines the term, walks through the data model behind it, compares it with LLM observability and APM, and lays out 5 steps to instrument a production agent.
What is AI agent observability?
AI agent observability is the practice of capturing, connecting and evaluating every step an AI agent takes in production, from LLM calls and tool calls to outcomes, so teams can explain and fix its behavior.
AI agent observability combines two things classic observability keeps apart: telemetry about what happened, and judgment about whether it was right. The telemetry is a structured record of each run. The judgment comes from evals, an evaluator plus the score it produces, attached to the same records. Together they let you answer the question a stack trace can't: why did the agent choose that?
The term has close neighbors, so it helps to say what AI agent observability is not:
- "Agentic observability" can mean either. Some vendors use it for observing AI agents, others for AI agents that do observability work, such as triage and root cause analysis. This page covers the first; agentic observability in the second sense has its own page.
- Not LLM observability. LLM observability watches individual model calls. Agent observability follows a chain of calls, tools and handoffs toward a goal.
- Not APM with a new label. Application performance monitoring tells you a service is fast and up. It has no view of whether the agent's plan or answer was correct.
- Not offline testing alone. Pre-release evals catch known failures. Production observability catches the ones nobody wrote a test for.
Why do AI agents need their own observability?
Traditional monitoring asks whether the service is up. Agent observability asks whether the agent did the right thing. Four properties of agents make the second question hard.
Non-determinism
Agentic applications are non-deterministic: the same input can take a different path on the next run. Fixed settings don't pin that down. In one study of LLMs run with settings meant to be deterministic, accuracy varied by up to 15% across runs, with a gap of up to 70% between the best and worst run (arXiv 2408.04667). Thinking Machines sent one prompt 1,000 times at temperature 0 and got 80 unique completions.
For an agent, a different completion can mean a different tool, a different plan and a different outcome. You can't test your way to certainty before launch, so you have to see what happens after it. (Related reading: testing non-deterministic AI agents)
Multi-step failure
Agents fail in chains. A retrieval misses a document, the planner works from the gap, and the final tool call acts on the wrong premise. Researchers who built a failure taxonomy from more than 1,600 traces found failure rates of 41% to 86.7% across 7 open-source multi-agent systems, spread over 14 failure modes (MAST, arXiv 2503.13657).
Anthropic's engineering team describes the same effect: "One step failing can cause agents to explore entirely different trajectories." The final response is the last place the cause shows up. Finding it means keeping every step, in order, with its inputs and outputs. (Related reading: common multi-agent system failures)
Silent failure
Most agent mistakes raise no exception. The tool returns data, the model returns fluent text, the status code is 200, and the answer is still wrong. In the MAST study, a whole category of failures came from verification: agents that stopped early, or checked their work incompletely or incorrectly.
Grading only the final output misses much of this. One 2026 benchmark found that evaluation blind to the agent's trajectory missed 44% of safety violations (Claw-Eval, arXiv 2604.06132). Anthropic's team hit the same wall: users reported agents "not finding obvious information," and only full production tracing showed why. (Related reading: AI hallucinations in autonomous agents)
Compounding cost
Every reasoning step, retry and handoff spends tokens, and agents take far more steps than a chat exchange. Anthropic measured agents using about 4 times the tokens of chat interactions, and multi-agent systems about 15 times. Gartner predicts that AI inference costs per agentic workflow will increase more than fivefold through 2028.
A loop that never errors can run up the bill unnoticed, because spend usually sits in a billing console, apart from the trace that explains it. Tie cost to the run that produced it. (Related reading: agent tokenomics)
None of these show up as a red light on a service dashboard. They show up as a pattern across traces, and only if you capture the traces and grade them.
How does AI agent observability work?
AI agent observability works by recording each agent run as a tree of nested units, then attaching scores to the units that matter. Most tools now share the same three-level model: sessions, traces and spans.
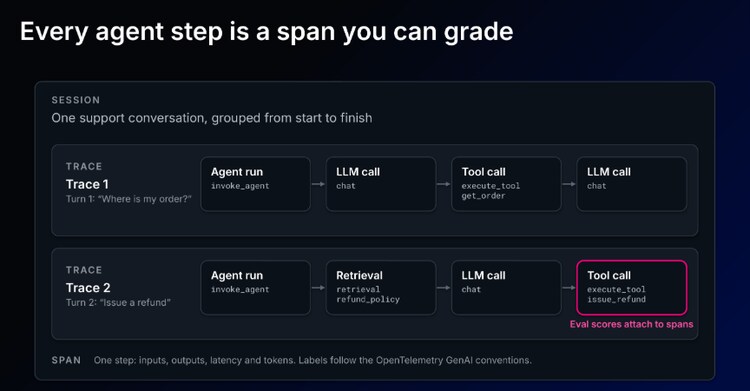
Figure 1. One session holds a trace per turn; each trace is a chain of spans, and eval scores attach to the spans.
Sessions
A session groups the traces of one multi-turn interaction, such as a full support conversation. Session-level data is where you see intent change, repeated questions and goals the agent never finished. (Sessions overview)
Traces
A trace records one turn, request or workflow from input to output. For a single user message, the trace shows every step the agent took to answer it, in order, with timing.
Spans
A span is one step inside a trace: an LLM call, a tool call, a retrieval or an agent handoff. Each span carries its inputs, outputs, latency and token counts, and it is the natural place to attach an eval.
OpenTelemetry GenAI conventions
The OpenTelemetry GenAI semantic conventions are standardizing names for these steps, such as invoke_agent for an agent run and execute_tool for a tool call. The agent span conventions are still marked Development, so expect attribute names to shift. Instrumenting with OpenTelemetry now keeps your traces portable as the standard settles. (Related reading: what is OpenTelemetry?)
If you know distributed tracing, the shape is familiar. The difference is the payload: agent spans carry prompts, tool arguments and model outputs, which is what makes them gradeable.
The 4 signals of AI agent observability
AI agent observability rests on 4 signals. Each answers a different question, and a gap in any one turns a failure into a guess.
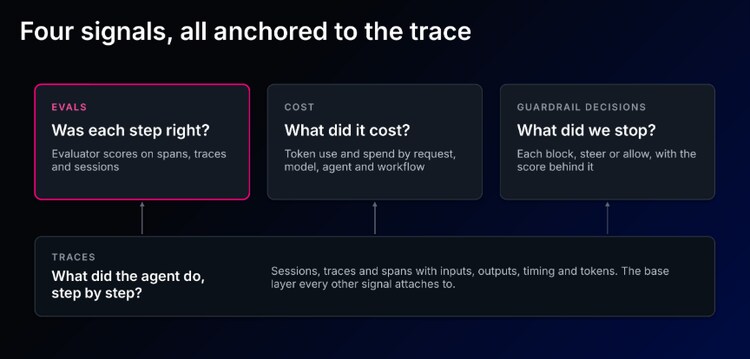
Figure 2. Traces are the base layer; evals, cost and guardrail decisions attach to them.
| Signal | What it captures | Question it answers | Failure it catches |
| Traces | Sessions, traces and spans with inputs, outputs, timing and tokens | What did the agent do, step by step? | A tool called with the wrong argument |
| Evals | Evaluator scores on spans, traces and sessions | Was each step and the final answer right? | A grounded-sounding answer the context doesn't support |
| Cost | Token use and spend by request, model, agent and workflow | What did this run cost, and was it worth it? | A retry loop that never errors but keeps spending |
| Guardrail decisions | Each block, steer or allow, with the score behind it | What did we stop, and why? | PII about to leave in a tool call |
Traces are the base layer: the other three attach to them. Evals turn a record into a verdict. Cost ties that verdict to spend, so a correct answer at ten times the usual token count still shows up. Guardrail decisions close the loop: once you trust an eval, the same score can stop the action instead of only reporting it.
AI agent observability vs. LLM observability vs. APM
AI agent observability, LLM observability and APM watch different units of work, so each defines failure differently.
| Dimension | APM | LLM observability | AI agent observability |
| Unit of analysis | A request through services | One model call | A session of multi-step runs |
| What counts as failure | Errors, latency, saturation | A poor or unsafe completion | A wrong decision anywhere in the chain |
| Primary data | Metrics, logs, service traces | Prompts, completions, tokens | Spans for LLM calls, tools, retrieval and handoffs, plus eval scores |
| Typical question | Is the service healthy? | Was this response good? | Why did the agent do that, and was it right? |
| Main user | SRE, platform team | ML engineer | AI platform team, agent developer, SRE |
Decision rule: if your app makes one model call per request, LLM observability covers it. Once the app picks tools, plans steps or hands work between agents, you need agent observability. Keep APM either way for the services and infrastructure underneath.
Failure patterns agent observability catches
Most agent failures fall into a handful of patterns, and each maps to a signal you can grade. The names in parentheses are common agentic evaluator names.
- Wrong tool, or right tool with wrong arguments (Tool Selection Quality). The agent calls search when it needed the order API, or passes yesterday's order ID.
- Tool errors hidden by retries (Tool Error). The call fails, the agent retries quietly, and the final answer looks fine while latency and cost climb.
- Goals left unfinished (Action Completion). The agent answers part of a two-part request and stops.
- Loops and wasted steps (Agent Efficiency). The agent repeats the same lookup or bounces between two subagents.
- Intent drift across turns (User Intent Change). The user changes goals mid-session and the agent keeps working the old one.
- Answers the context doesn't support (Context Adherence). Retrieval returned the right documents, and the model wrote something else.
- Sensitive data and hostile input (PII, Prompt Injection). An account number lands in a tool call, or a retrieved page carries instructions the agent follows.
Predefined evaluators catch the patterns you already know. For the ones you don't, look across traces for clusters of similar failures, then write an evaluator for each new pattern so it stays caught.
How to get started with AI agent observability
Start with one production agent and 5 steps. Each step builds on the one before it.
Step 1: Instrument the agent
Capture every LLM call, tool call and retrieval as a span. Use your framework's integration if one exists (LangChain, LangGraph, CrewAI, OpenAI Agents SDK and others), or OpenTelemetry for custom code. Log inputs and outputs, not only timing, or there is nothing to grade later.
Step 2: Group traces into sessions
Pass a session ID with each request so multi-turn conversations stay together. Without sessions, you can grade single answers but not whether the user got what they came for.
Step 3: Add evals where failure costs the most
Pick the 2 or 3 failure patterns that would hurt most if they reached a customer, such as wrong tool calls, unsupported answers or PII. Attach an evaluator to the spans where each one happens. Grade production traffic, not only test sets.
Step 4: Review patterns, then turn them into evaluators
Once a week, look at the lowest-scoring sessions and the clusters behind them. Each new failure pattern becomes a new evaluator, so the next occurrence is caught automatically.
Step 5: Promote trusted evals to guardrails
When an evaluator's scores match what your domain experts would say, run it in the request path. The same score that used to flag a bad action after the fact now blocks or steers it before the tool fires. (Related reading: what is a guardrail in AI?)
How Splunk Agent Observability helps with AI agent observability
Splunk Agent Observability brings the 4 signals into one place, so a bad answer, its cost and the infrastructure under it land on the same timeline.
- Visibility: trace a workflow from request to response across tool calls, models and retrieval steps, then correlate it with the infrastructure it ran on, down to the GPU.
- Evaluation: score correctness, tool use and safety with preset and custom evaluators. Splunk Luna evaluators, purpose-built small language models, cost up to 98% less than LLM-as-judge, according to Splunk.
- Signals: Signals analyzes production traces to surface failure patterns that predefined evaluators and manual searches miss, and turns a pattern into an LLM-as-a-judge evaluator in one step.
- Guardrails: turn the evaluations you trust into runtime guardrails for PII, PHI and PCI leakage, tool misuse and prompt injection, enforced before the tool runs.
The product page says evaluation and guardrails run on every interaction in production, not a sampled slice. Coverage and Splunk Luna evaluator availability depend on your deployment, so confirm both for your environment.
Conclusion
AI agent observability shifts the question from "is it up?" to "was it right?" Capture traces with their inputs and outputs, group them into sessions, grade the steps that carry the most risk, and promote the evals you trust into guardrails. Start with one agent and the failure patterns that would cost you most. The service being up was never the goal. The agent being right is.
Learn more about Splunk Agent Observability and get hands-on with Splunk Observability Cloud Free Edition today.
FAQs about AI agent observability
Related Articles

6 Best AI Agent Observability Tools for Production in 2026

ISMS: Information Security Management Systems Explained