Workload Pricing and SVCs: What You Can See and Control
Platform Samir ViraniSplunk is committed to using inclusive and unbiased language. This blog post might contain terminology that we no longer use. For more information on our updated terminology and our stance on biased language, please visit our blog post. We appreciate your understanding as we work towards making our community more inclusive for everyone.
Updated 7/31/2023 with revised SVC utilization views to reflect recent CMC improvements.
The Cloud Monitoring Console (CMC) lets Splunk Cloud Platform administrators view information about the status of a Splunk Cloud Platform deployment. For Workload Pricing, the CMC lets you monitor utilization of Splunk Virtual Compute units (SVCs). Check out this blog if you want to learn more about SVCs.
SVC utilization is a statistical measurement of the resources that are employed in practice, compared to the customer’s SVC entitlement. The intent of this measurement is two-fold. One, to provide Splunk Cloud Platform system administrators with workload detail against capacity such that they can track and optimize workloads (e.g., timing or distribution of work among constituent users). Two, to provide an indication when the SVC utilization may be approaching SVC entitlement. A critical caveat for both purposes is that SVC utilization as presently measured does not encompass all of the dynamics impacting system health and performance. For example, SVC usage does not directly measure I/O bandwidth on indexing or search nodes, but for certain workloads this can become an important constraint. The maximum utilization we can expect to see is around 80%, after which system performance will begin to decline. CMC is consistently evolving based on customer feedback, and deeper visibility and breakdown of SVC utilization is a consistent theme. You can learn more about how to manage your console here.
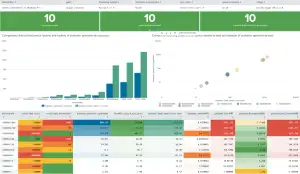
Monitor your SVC usage by navigating to Cloud Monitoring Console > License Usage > Workload. From here, you will be able to see the following usage panels:
Peak SVC usage within selected time granularity (1-hour, 15-min, 5-min)

Peak SVC usage as a % of provisioned SVC by tier (search head and indexer) within selected time granularity (1-hour, 15-min, 5-min)

Peak SVC usage per hour split by consumer (ingestion, search, and shared services)

(Search seconds, SVC usage)* per hour by search type

(Search Seconds, SVC usage)* per hour by top 10 (apps, searches, users)*

Dispatched and skipped search count per hour

Peak SVC usage per hour by ingestion source (index, sourcetype)*

Hourly rate of ingestion

Levers You Can Use to Change SVC Usage
There are several aspects of an efficient and healthy Splunk Cloud Platform stack. The more efficient a stack is, the more value you will get out of each SVC. Here are some ways to get more efficient with SVC utilization.
Considerations for improving the search profile:
- Search frequency: How often searches are running
- Search density: How many data sources and how wide of a time range your searches run against
Practical tips to improve SVC utilization of searches:
- Review Unscoped Data Models and All Time Searches
- Review Skipped Searches and adjust the frequency or scheduling
- Ensure that Scheduled Searches are evenly distributed and not skewed
- Review Long Time Running Searches and optimize the SPL
- Disable Unused Scheduled Searches
- Remove unused Apps and Technology Add-ons
You can learn more about search and ingest through the following courses we offer:
- The Splunk Admin education courses teach our best practices for running a healthy Splunk environment.
- Splunk Fundamentals 1 and 2 will help your users and power users build more efficient searches, reports, alerts and dashboards. This will greatly improve your SVC usage.
- Leverage Admin on Demand or Professional Services when needed
Further, you can take advantage of the prebuilt dashboards in the CMC. There are also prebuilt views of both search and ingest health. Every item represented in the CMC is an aspect of Splunk that you can take into account as your business requirements continue to evolve.
To Sum Up
The Workload Pricing model helps you to optimize the Splunk Cloud Platform based on your data use cases, while allowing you to monitor and manage your usage through the CMC. For more information about the Workload Pricing model, check out what makes up Splunk Virtual Compute (SVCs) and watch the video below.
*This blog was originally published on September 13, 2021; last updated on July 31, 2023.
Related Articles

Advanced Painting with Data: Choropleth SVG
Deep Learning Toolkit 3.7 and 3.8 - What’s New?
