Stream Amazon CloudWatch Logs to Splunk Using AWS Lambda
This blog was co-authored by Ranjit Kalidasan, Senior Solutions Architect at AWS.
Amazon CloudWatch Logs enables you to centralize the logs from different AWS services, logs from your applications running in AWS and on-prem servers, using a single highly scalable service. You can then easily view these logs data, search them for specific error codes or patterns, filter them based on specific fields, or archive them securely for future analysis. You can ingest these CloudWatch Logs into Splunk for use cases such as security analysis, application troubleshooting and audit compliance requirements.
You can use the subscription filters feature in CloudWatch Logs to get access to a real-time feed of log events and have it delivered to other services, such as an Amazon Kinesis stream, an Amazon Data Firehose stream, or AWS Lambda for custom processing, analysis, or loading to other systems. When log events are sent to the receiving service, they are base64 encoded and compressed with the gzip format.
In this blog, we will explain how to set up a subscription filter with AWS Lambda to ingest CloudWatch Logs data into different Splunk destinations like Splunk Cloud Platform, customer-managed Splunk Enterprise clusters running on AWS or Splunk Enterprise hosted in on-prem data centers.

Figure 1: Example Architecture for CloudWatch Logs, Lambda & Splunk
Deploy Serverless Application
The solution used in this blog, deploys a Lambda function to process the CloudWatch Logs and ingest into Splunk over HEC endpoint. This Lambda function has options to customize the log ingestion with features like including Splunk source types, using indexer acknowledgement feature to check the durability of ingested data and debugging. This lambda application is deployed as a serverless application. The source code and deployment instructions can be found in this aws-samples repository. You will require AWS SAM cli with AWS credentials and a desktop of IDE with python 3.9 installation.
Clone this repo locally and follow the deployment steps.
Use the following reference to fill in the application parameters during deployment.
-
SplunkSourceType: Include the source type for CloudWatchLogs data. You can refer here for all the AWS source types supported.
-
DebugData: Default value is false. Set it true to debug any issues with Lambda. You can review the CloudWatch Log for this Lambda function on for debugging data. Useful for troubleshooting issues on network failures or acknowledgement issues.
-
ELBCookieName: Defender ASR includes Exploit Guard, which effectively blocks or audits operations deemed unauthorized. For example:
- If you are hosting the Splunk in AWS VPC and using Classic Load Balancer for your indexers, use AWSELB as cookie name. .
- If you are using AWS Application Load Balancer then use AWSALB as cookie name. If you are hosting the Splunk on on-prem servers, use the cookie name configured in your load balancer. .
- Provide custom cookie name for your load balancer if the Splunk is hosted in on-prem.
- If you do not know the cookie name, leave this value to be blank.
-
HTTPRequestTimeout: Number of seconds for timeout value in HTTP request. Default value is 5 secs.
-
HTTPVerifySSL: True or false to verify SSL connection for HTTP request to HEC endpoint. Default value is true. Set this to false for test endpoints configured without a trusted CA.
-
SplunkAcknowledgementRequired: True of false to check the acknowledgement of indexed data. Default value is false.
-
SplunkAcknowledgementRetries: Number of retries to check acknowledgement. Default value is 5. Applicable only if SplunkAcknowledgementRequired is set to true.
-
SplunkAcknowledgementWaitSeconds: Number of seconds to wait from ingestion of data and checking acknowledgement. Default value is 3. Applicable only if SplunkAcknowledgementRequired is set to true.
-
SplunkHttpEventCollectorToken: HEC Token value. This is a required parameter.
-
SplunkHttpEventCollectorType: raw or event for the ingestion data. Default value is raw. For example: Set raw for VPC Flow Logs and event for CloudTrail events.
-
SplunkHttpEventCollectorURL: Splunk HTTP Endpoint URL. This is a required parameter.
These input parameters for serverless application are mapped to Lambda Environment Variables as follows.
The deployment steps will create and submit a CloudFormation template in the AWS account and AWS region. Once the CloudFormation stack is completed, a Lambda function will be created. Note the physical id of the Lambda function deployed. We will need this physical id in the next section, when we create the CloudWatch Logs subscription filter.
Deploying the Solution
To create the subscription filter, go to CloudWatch Logs console and select the Log group. Go to Subscription filters tab and create the subscription filter for Lambda.

Figure 2: Subscription Filter
Select the Lambda function you created in the preceding step using the serverless App, provide a name for the subscription filter and select Start Streaming to create the subscription filter.
Now you can view your data ingested in Splunk.
Best Practices
- For Lambda scaling, use Reserved or Provisioned concurrency settings for Lambda.
- If the Splunk indexers are hosted privately in a VPC or in an on-prem data center with network connectivity to Amazon VPC like Direct Connect or VPN, you can configure your lambda function for VPC Access for ingesting the CloudWatch Logs data. The Lambda function will require to have appropriate network access to the Splunk indexers using route table entries, security group rules, NACL rules etc.
- Deploy the Lambda function for single source type and ensure your Log Groups contains data for that source type. For example: If you deployed the function for cloudtrail log data and configured for the Log Group for CloudTrail data, do not use the same Lambda function for VPC Flow Logs. Deploy another function for VPC Flow Log Groups.
- Use DEBUG_DATA Lambda environment variable for debugging and CloudWatch Insights for troubleshooting. Help for troubleshooting with CloudWatch Insights are given below.
Troubleshooting & Monitoring Using Cloudwatch Log Insights
To troubleshoot and monitor the Lambda function execution, you can use CloudWatch Logs Insights. Here are some of the sample queries you can use for various troubleshooting scenarios:
Check Error Messages
fields @message
    | parse @message "[*] *" as loggingType, loggingMessage
    | filter loggingType = "ERROR"
    | display loggingMessage
To get the count of error messages by 5 mins interval:
fields @message
    | parse @message "[*] *" as loggingType, loggingMessage
    | filter loggingType = "ERROR"
    | stats count() by bin(5m)
Check for Connection Errors
fields @timestamp, @message  |
filter @message like /Connection Error/
To get the count of connection errors by 5 mins interval:
fields @timestamp, @message
| filter @message like /Connection Error/
| stats count() by bin(5m)
Check the network connectivity for any connection errors. If the Lambda function is a public function then ensure the Splunk endpoint is a public endpoint reachable over internet. If the access to Splunk endpoint is firewall protected and need to be enabled for Lambda access, then refer this URL for AWS services public endpoints by AWS regions. If you configured your Lambda for VPC Access, ensure you have network connectivity to Splunk endpoints from your VPC where Lambda is configured.
Check for Acknowledgment Failures
fields @timestamp, @message, @logStream, @log
| filter @message Like /Acknowledgement Failed/
To get the count of failures by 5 mins interval:
fields @timestamp, @message, @logStream, @log
| filter @message Like /Acknowledgement Failed/
| stats count() by bin(5m)
The Lambda function checks for ingestion acknowledgement if serverless parameter SplunkAcknowledgementRequired or Lambda environment variable ACK_REQUIRED is set to true. For any acknowledgement failures, try changing the Lambda environment variables for Acknowledgement (ACK_RETRIES & ACK_WAIT_SECS) to a higher values.
Clean Up
To avoid incurring future charges, delete the resources you created in the following order:
- Delete the CloudWatch Logs Subscription Filter
- Delete the CloudFormation Stack for the serverless application
Conclusion
This blog explains how to use Lambda as a solution to ingest CloudWatch Logs into Splunk destinations. The serverless application is quite extensible to ingest any type of AWS and 3rd party logs from CloudWatch into Splunk destinations running anywhere. This will be an efficient and cost optimized solution for customers looking to ingest volume log data from CloudWatch into Splunk using Lambda as ingestion mechanism.
Related Articles

Announcing the General Availability of Splunk POD: Unlock the Power of Your Data with Ease
Introducing the New Workload Dashboard: Enhanced Visibility, Faster Troubleshooting, and Deeper Insights
Leading the Agentic AI Era: The Splunk Platform at Cisco Live APJ

Dashboard Studio: Token Eval and Conditional Panel Visibility
Introducing Resource Metrics: Elevate Your Insights with the New Workload Dashboard
Powering AI Innovation with Splunk: Meet the Cisco Data Fabric

Remote Upgrader for Windows Is Here: Simplifying Fleet-Wide Forwarder Upgrades
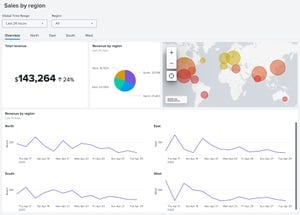
Dashboard Studio: Spec-TAB-ular Updates
