Tag: Splunk Observability Cloud
Latest Articles
displayMode
paginated
filter
tags
tags
Splunk Observability Cloud
showImagesOnMobile
false
limit
9

.conf & .conf Go
1 Minute Read
Introducing the First-ever Observability Track at .conf22
Dive into the .conf22 Observability Track, featuring over 40 breakout sessions led by Splunk customers, partners and practitioners aimed at showing how you can monitor, troubleshoot and innovate faster than ever before with full-stack, end-to-end visibility.

Observability
4 Minute Read
Observability for AWS Fargate Deployments Powered by Graviton2 Processors
Splunk is proud to partner with Amazon for AWS Graviton2 as a new architecture for AWS ECS Fargate. With SplunkⓇ Observability Cloud, teams can get all their answers in one place with unified metrics, traces and logs collected in real time.

Observability
5 Minute Read
Azure DevOps: Fun with Observability Events and Alerts!
With Splunk Observability Integrations for Azure DevOps you can visualize your pipeline runs, releases, and protect yourself from errant releases during major events or service outages.

Observability
3 Minute Read
How to Simplify Your Out-of-the-Box Alerting with NEW! AutoDetect
AutoDetect provides out-of-the-box alerts for quick time to value. Get started in minutes to discover anomalies across the hybrid infrastructure within seconds.

Observability
5 Minute Read
The Five Tenets of Observability
Observability is essential for technology success. Learn the five key tenets of an Observability system and the benefits of Observability for your company.
Observability
4 Minute Read
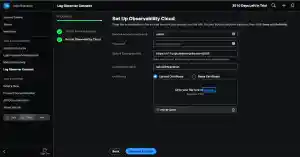
Splunk Enterprise Logs Now Available in Splunk Observability for Simplified Troubleshooting
Splunk Log Observer Connect for Splunk Enterprise, previewed at .conf21, is now generally available! Log Observer Connect lets observability users explore the data already being sent to existing Splunk instances with Splunk Log Observer’s intuitive no-code interface for faster troubleshooting and root-cause analysis.

Observability
5 Minute Read
Jenkins, OpenTelemetry, Observability
Leverage OpenTelemetry for Jenkins in Splunk Observability and monitor CI/CD performance.
Observability
6 Minute Read
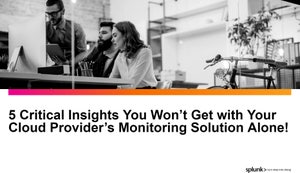
Five Critical Insights You Won't Get With Your Cloud Provider's Monitoring Solution Alone
The blog provides 5 Insights into why Splunk is necessary to assure health of your multi-cloud estate and covers specific examples of the added value over individual cloud provider monitoring tools.
Observability
2 Minute Read
Splunk RUM Frontend Error Monitoring is Now Generally Available!
Splunk RUM Frontend Error Monitoring Helps engineering teams quickly scope, prioritize, and isolate their most impactful customer-facing JavaScript errors.
/en_us/blog/fragments/subscribe-footer