Dashboard Studio: More Ways to Visualize Your Data
Platform Sophie ChuEvery dashboard starts with a question. The right visualization helps spot a pattern, add context, and explore the details.
Fresh from .conf26, we’re excited to share new ways to do that in Dashboard Studio. Across Splunk Cloud Platform 10.5.2605 through 10.7, we added a Treemap visualization, a Text component, and improvements to Table and Trellis charts.
For Splunk Enterprise, all the features in this blog are new in 10.6 except for Text. For more details, check out the What’s new in Dashboard Studio pages for Splunk Cloud Platform and Splunk Enterprise.
Treemap
Want to find which data center has bad health? Start with the big picture, then drill into the details.
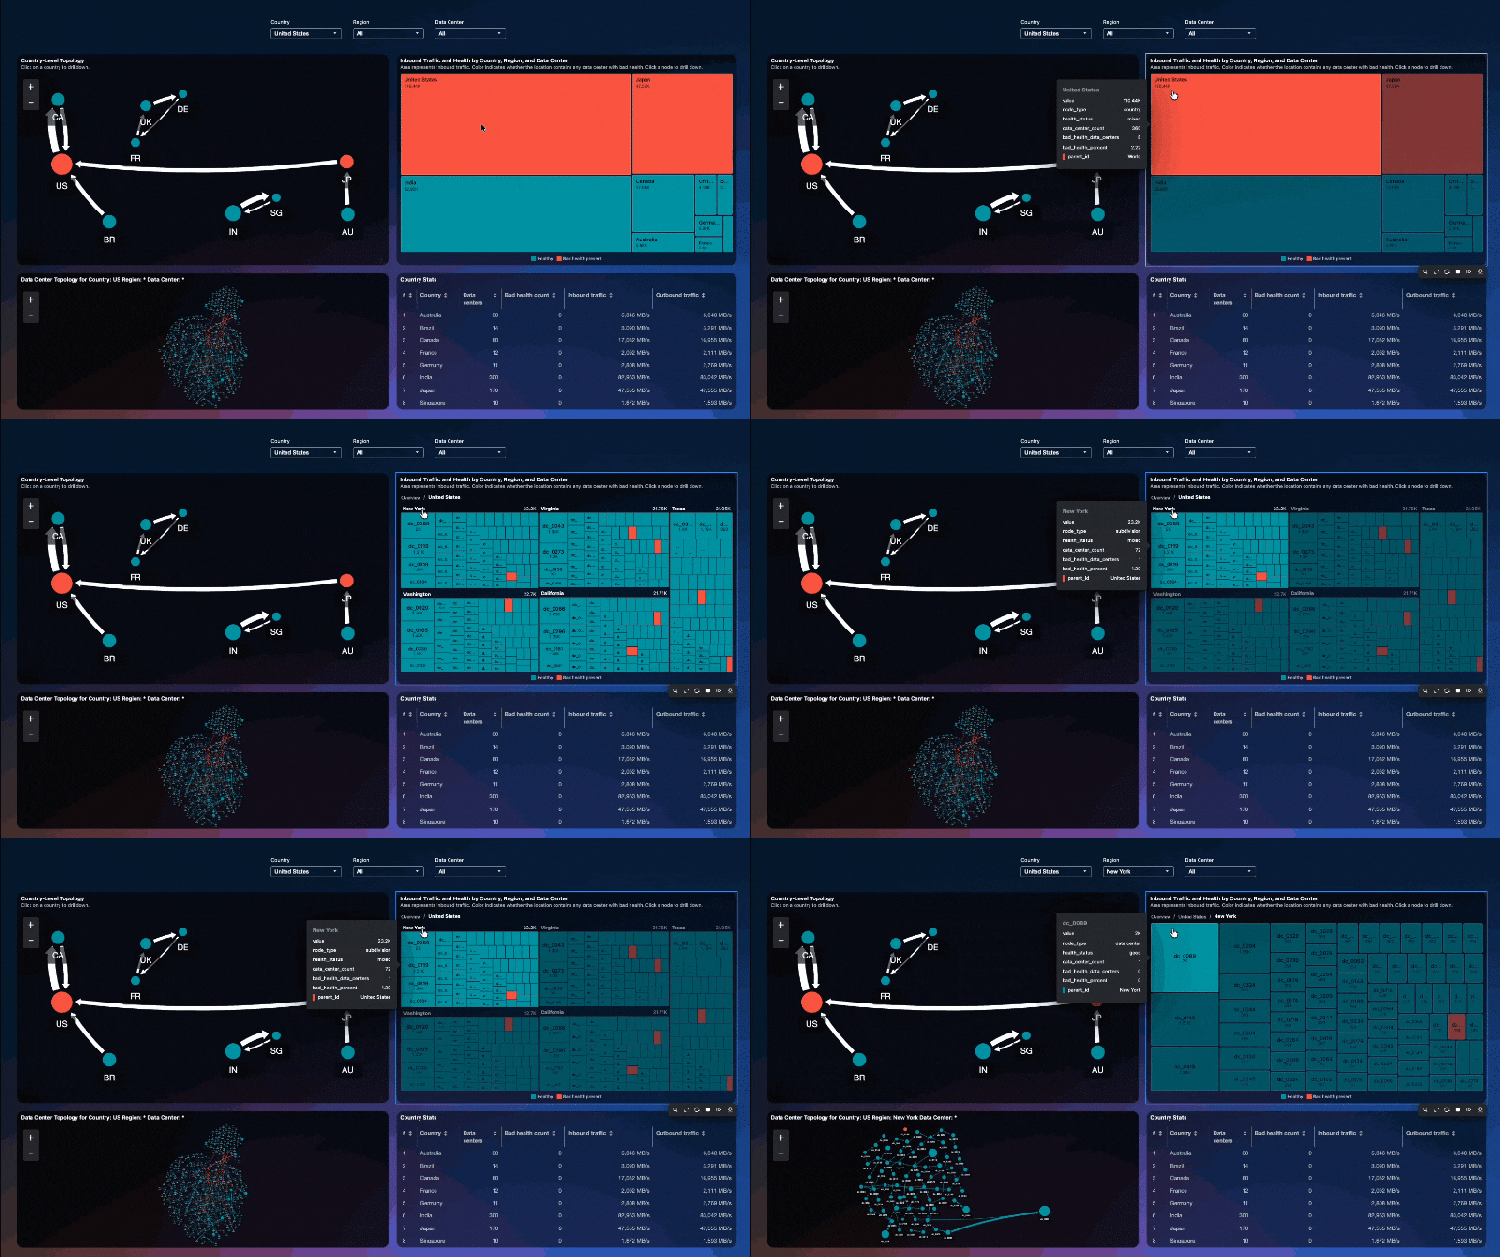
In this example, the Treemap shows inbound traffic across countries, regions, and data centers. The area of each rectangle represents traffic volume, while dynamic coloring highlights locations where bad health is present. Alongside it, one Network Graph shows topology between countries, while the other shows the topology of the selected data center.
Select a Treemap node to set tokens and update the adjacent visualizations as you drill from country to region to data center. There’s no fixed limit to the number of levels in the hierarchy can define, so you can shape the drilldown around your data. A configurable resultLimit lets you manage how many results Treemap renders.
Text
Need to add a little context or tell viewers what to look at? The new Text component gives you a what you see is what you get editor right on the dashboard canvas. Add headings, instructions, lists, links, and formatted text without writing Markdown.
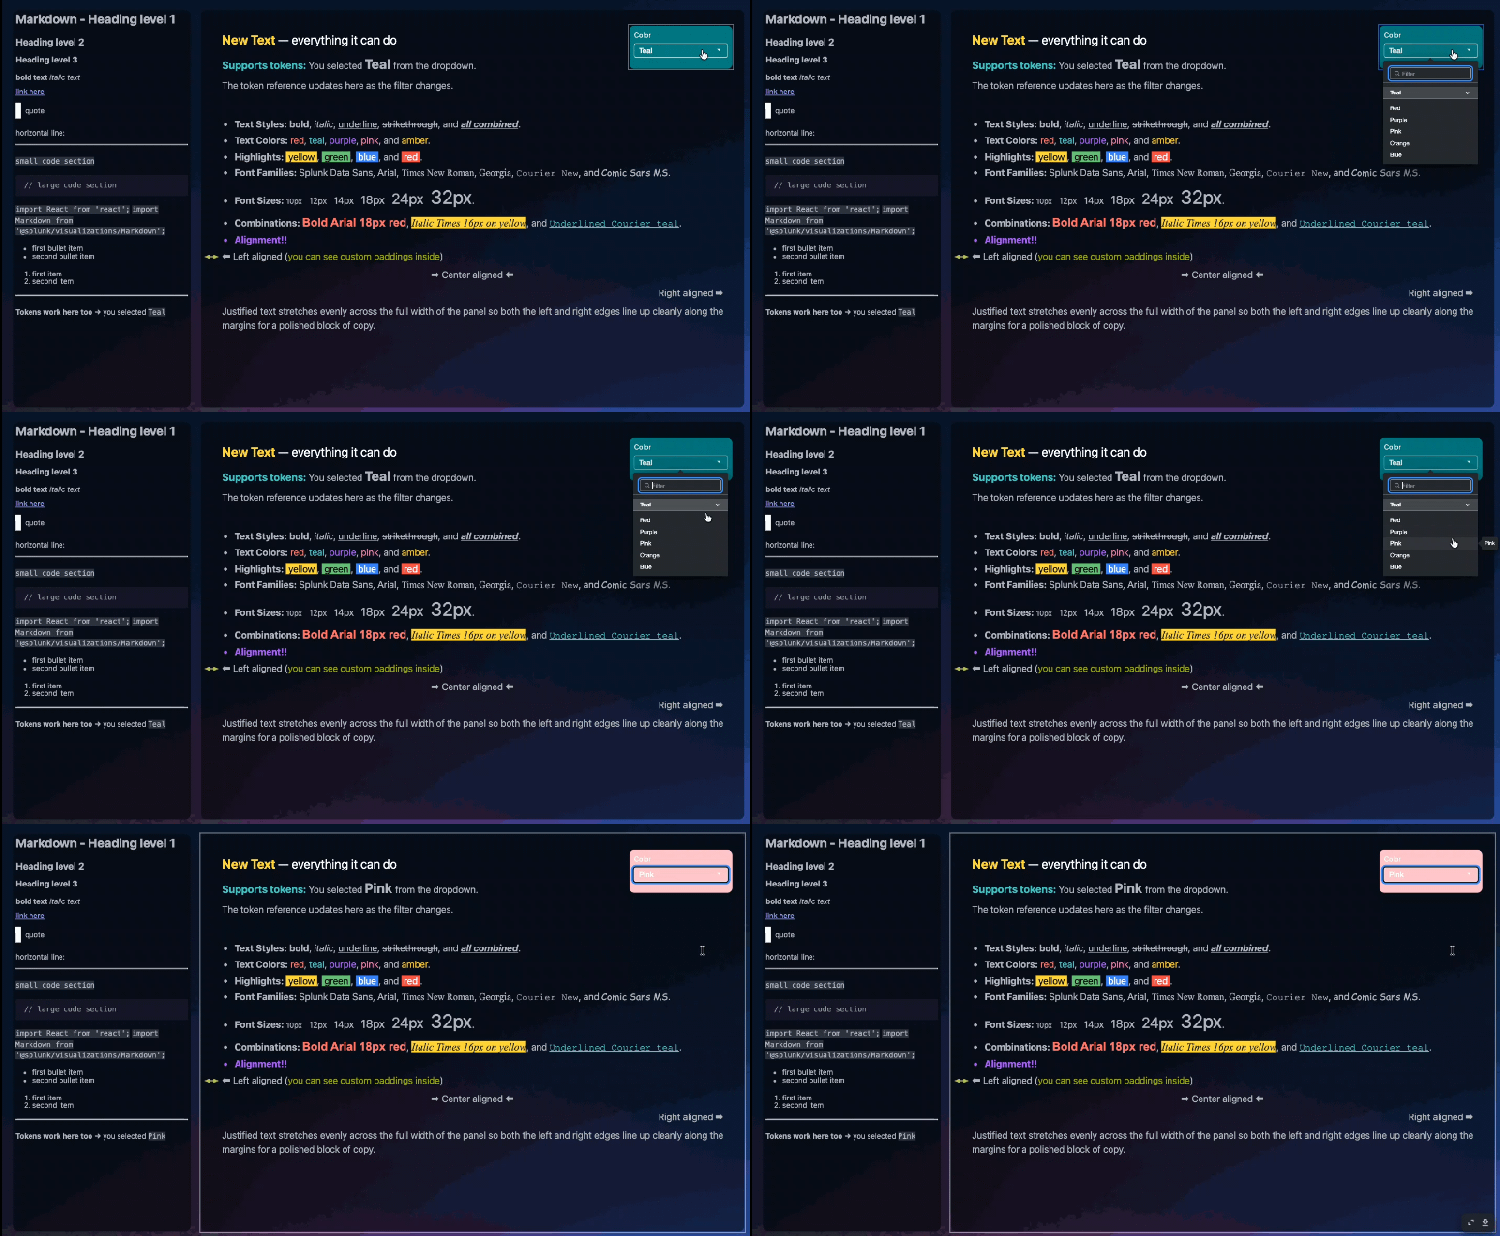
Text also supports tokens. In Edit mode, use Preview token values to see how the resolved token value will look with the configured formatting.
You Asked, We Delivered
Enhancements for Table
Table is the most used visualization in Dashboard Studio. You asked for more ways to show the data, so we made these enhancements:
- Dynamic table height lets a table grow or shrink in View mode to fit its data, up to the maximum number of rows displayed. In grid layout, the canvas adjusts to the table. In absolute layout, the canvas dimensions stay the same.
- Field specific interactions let you configure different actions for different fields, such as setting a token or opening a link.
- Table expansion and JSON rendering let viewers expand table content and inspect JSON values in an interactive tree.
Trellis Sorting Controls
Trellis charts make it easier to compare results across categories. One of your top Splunk Ideas was to add more control over panel order. Now dashboard builders can sort panels by result order, name, value, or trend where supported, in ascending or descending order.
Choose the order that brings the most useful comparisons into view!
What’s Next
We’re continuing to improve Dashboard Studio with feedback from dashboard builders. Planned updates include scheduled email exports for dashboards with tabs and modernized visualizations with gradient effects.
Have an idea for what we should build next? Share it through Splunk Ideas or upvote an existing one.
Helpful Resources
- Dashboard Studio: Build Custom Visualizations Faster
- Dashboard Studio demo
- Splunk Cloud Platform: What's new in Dashboard Studio
- Splunk Enterprise: What's new in Dashboard Studio
- Dashboard Studio Tutorial
- Improving Dashboard Performance and Resource Usage Tech Talk
- Splunk Dashboard Studio Documentation
- Splunk Community - Dashboards & Visualizations - Send over questions directly to our Splunk Experts.
- Examples Hub - Find the Examples Hub from the Dashboards page in Search & Reporting
This information is subject to change at any time, at the sole discretion of Splunk Inc. and without notice. This roadmap information shall not be incorporated into any contract or other commitment. Splunk undertakes no obligation to either develop or deliver any product, features, or functionality described here.
Related Articles

Bypassing the Bypass: Detecting Okta Classic Application Sign-On Policy Evasion

Security Modernization Starts with Data and Splunk at Black Hat 2021