Dashboard Studio: Build Custom Visualizations Faster
Platform Lizzy LiKey takeaways
- Splunk Cloud Platform 10.4.2604 and Splunk Enterprise 10.4 introduce a modern Dashboard Studio custom visualization framework with sandboxed security and simpler configuration.
- New CLI and SDK tools simplify custom visualization development with scaffolding, watch mode, React and TypeScript support, easier configuration, and streamlined packaging.
- AI can help create custom visualizations, while Splunk recommends rebuilding important Classic visualizations with the new Dashboard Studio framework.
In Splunk Cloud Platform 10.4.2604 and Splunk Enterprise 10.4, we introduced a new custom visualizations framework for Dashboard Studio.
You already know why custom visualizations matter. Sometimes your data needs a service dependency map, a telemetry replay, a security risk matrix, a custom KPI gauge, or a view that only makes sense for your team. The important part is what changed for developers: the new framework makes custom visualization development feel much more modern.
In this post, we will cover:
- The new framework architecture
- The developer tooling and CLI workflow
- How configuration changed from legacy custom visualizations
- How AI can help create a first draft
- How to think about new visualizations and legacy Classic custom visualization migration
A Modern Framework for Dashboard Studio
Dashboard Studio previously added support for rendering existing Classic custom visualizations so customers could bring more of their current dashboard investments forward. The new framework in Splunk Cloud Platform 10.4.2604 and Splunk Enterprise 10.4 is the recommended path for building new custom visualizations for Dashboard Studio.
The old custom visualization framework came with real friction. Developers had to use legacy RequiredJS / AMD module patterns, manage a long list of lifecycle methods, rebuild manually after every source change, and take on security responsibilities of escaping dynamic DOM values.
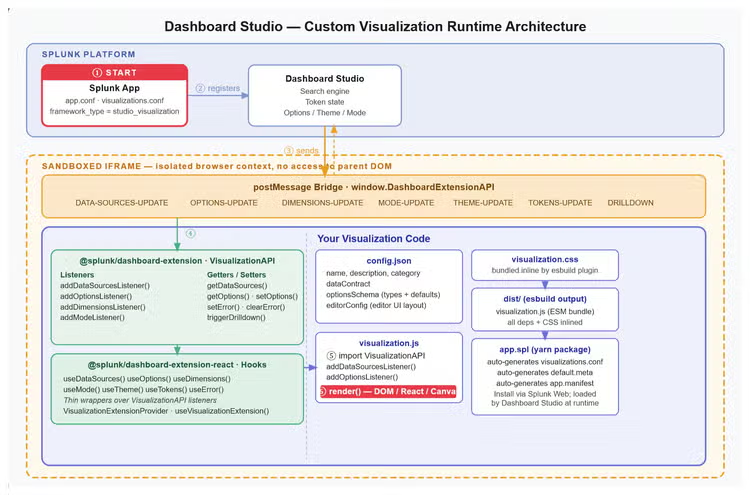
The new framework is designed to clean up that workflow. Custom visualization apps register with Dashboard Studio through `visualizations.conf`, using the Studio visualization framework type. Your visualization code then runs inside an isolated, sandboxed iframe, giving you security out of the box.
Communication between Dashboard Studio and the iframe happens through a `postMessage` bridge, which you do not need to wire yourself. The Dashboard extension SDK abstracts it through listener APIs such as `addDataSourcesListener` and `addOptionsListener`, so your visualization receives structured data, options, theme, and token updates without manually managing the underlying message layer.
From there, rendering is up to you. You can use plain DOM APIs, React, canvas, or another JavaScript approach that fits the visualization you are building.
Less Configuration Plumbing
In our Splunk Developer Day 2026 demo, we compared adding the same simple color option in the legacy framework and the new Studio framework.
In the legacy framework, adding one configurable property meant touching four places:
- `savedsearches.conf.spec`
- `visualizations.conf`
- `formatter.html`
- `visualization_source.js`
The property also had to be referenced through long, fully-qualified configuration strings. If one of those strings did not line up across files, the value could silently fail to bind.
In the new framework, the visualization configuration lives in `config.json`, as native JSON. You define the option once, including its default value and editor configuration, then consume it in your visualization code as a plain options object.
For the same color-option demo, the Studio version came down to:
- Add the option schema and editor configuration in `config.json`.
- Add an options listener in `visualization.js`.
- Use the option in the render function.
This is the kind of change that matters when your visualization evolves from "just one option" to a full set of useful author controls. Dashboard creators get UI configuration. Developers get a cleaner source of truth.
Developer Tooling That Gets You Moving
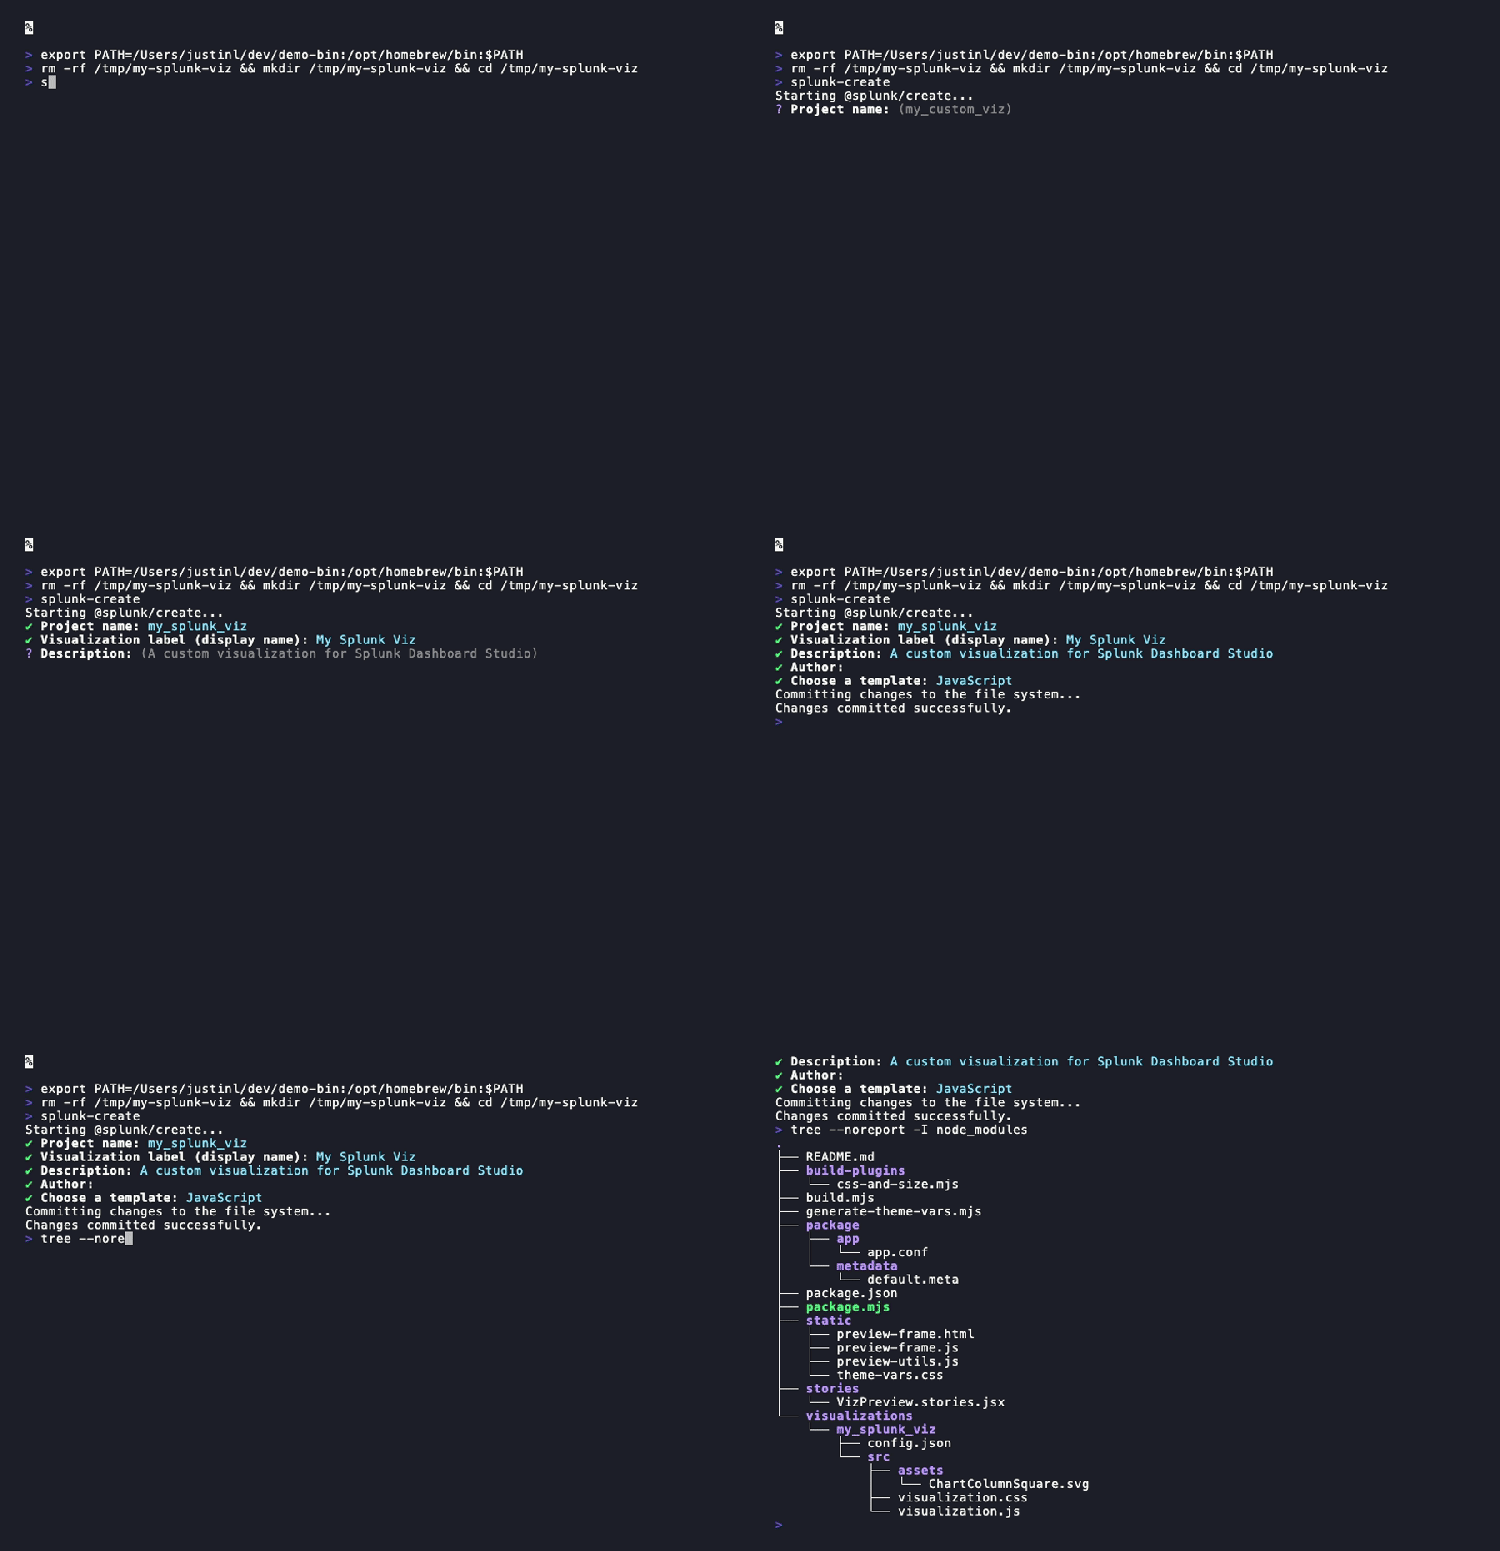
The new framework comes with tooling to scaffold, develop, build, and package a custom visualization as a Splunk app.
To start a project, run:
```bash
npx @splunk/create@latest --mode=dashboard-studio-extension
```
The CLI prompts you for project details and creates the files and directories needed to get started. Instead of downloading a zip template and wiring things together manually, you can scaffold a working project in one step.
Template options include vanilla JavaScript and React, with TypeScript support and exported types available through the developer packages. Choose the simplest starting point that fits your visualization. If you are rendering directly to a canvas, vanilla JavaScript may be enough. If your visualization needs richer component state, React is a natural fit.
The generated project includes the pieces you need:
- Visualization source code
- `config.json`
- App metadata
- Build scripts
- Watch mode
- Package scripts
The local development loop is straightforward:
```bash
yarn install
yarn dev
yarn build
yarn package
yarn preview
```
Use `yarn dev` while you iterate. Watch mode means you do not need to manually rebuild the app after every source change like you did with legacy custom visualizations.
Use `yarn build` when you are ready to generate the production bundle. Use `yarn package` when you want an installable `.spl` file for your Splunk environment.
Use `yarn preview` when you are ready to test your visualization in a local testing environment with hot reloading.
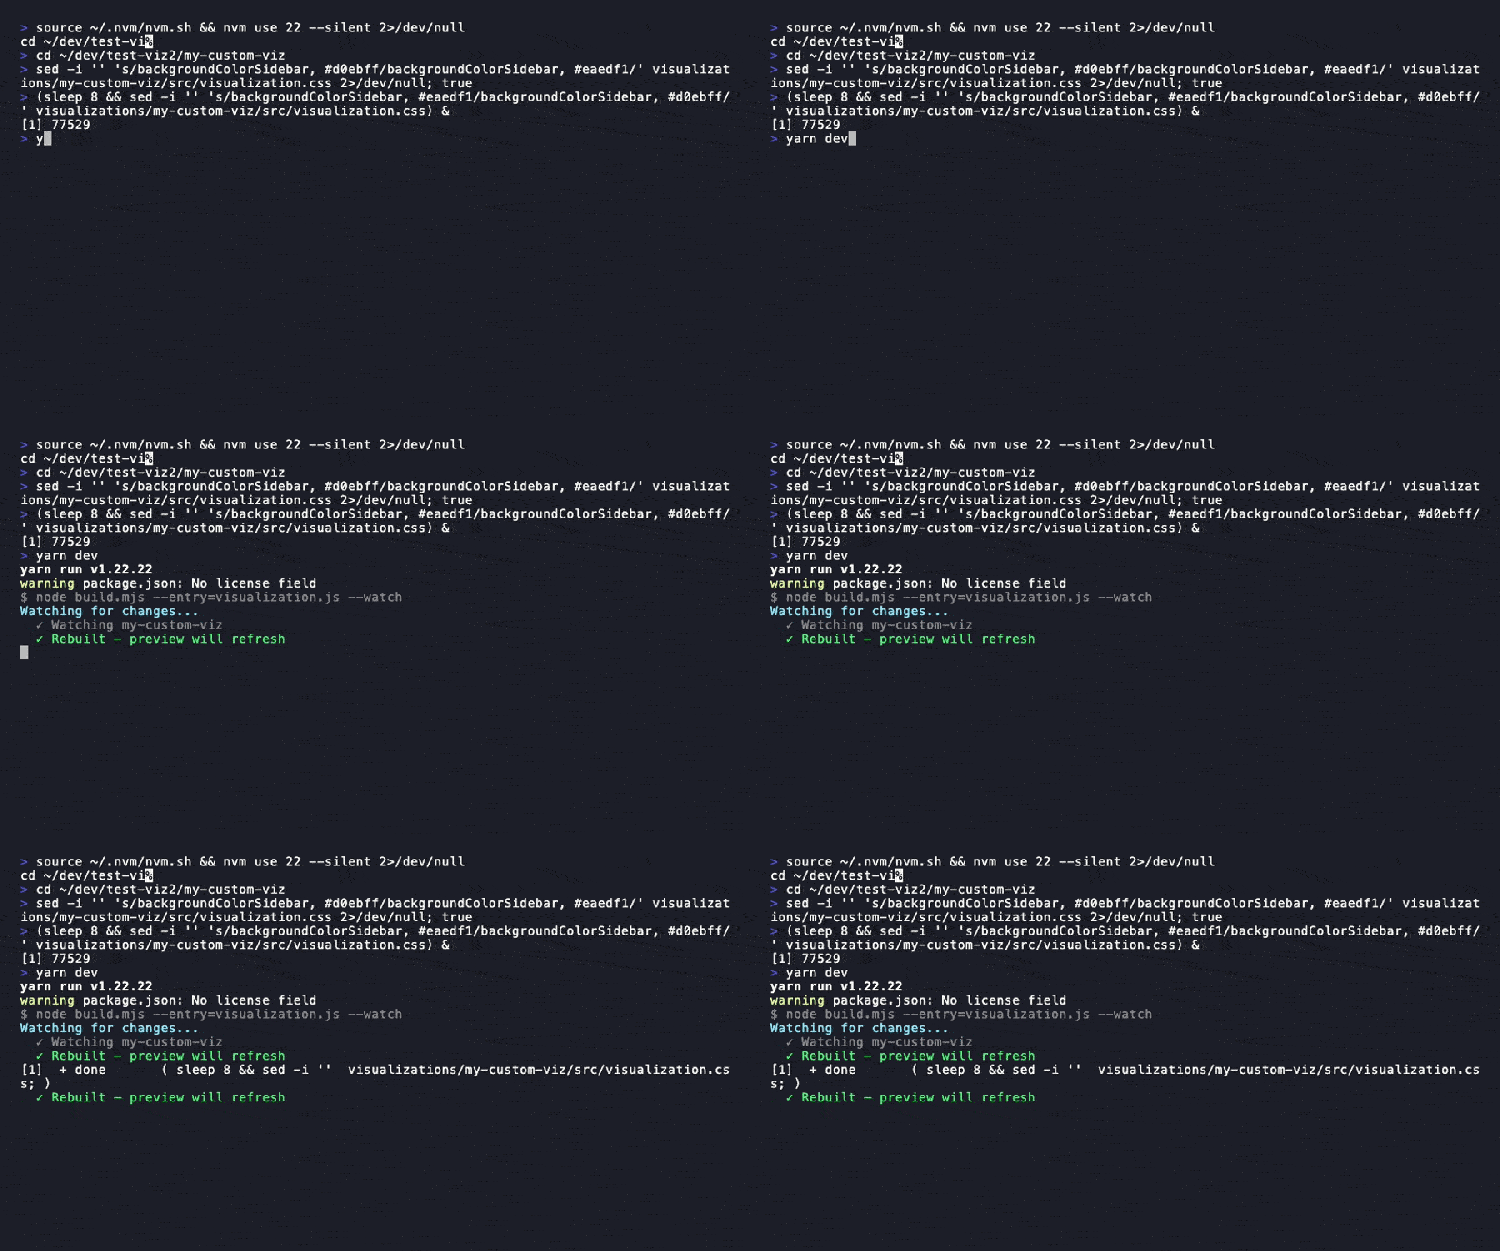
That packaging step handles the app structure for you: it validates the project, copies the built visualization bundle into the right location, generates the required Splunk configuration, and creates the installable app archive.
Pro tip: Start by getting one working data shape into the visualization before adding a large configuration surface. Once the data contract is stable, add author options through `config.json` so dashboard creators can adjust the visualization without editing code.
The SDK Handles the Bridge
The new developer tooling has two main pieces:
- Dashboard extension SDK
- Splunk create CLI
The SDK gives you the APIs for the communication layer between the sandboxed iframe and Dashboard Studio. Instead of reading values through framework-specific lifecycle methods or concatenated namespace strings, you can listen for the things your visualization needs.
For example:
- Data source updates
- Option changes
- Theme changes
- Token updates
There is also React support, with hooks for developers who prefer React patterns, plus TypeScript support with exported types.
The CLI gives you the project scaffolding and the ESBuild-based pipeline for watch mode, building, and packaging.
Together, those tools cover the parts of custom visualization development that used to be easy to get wrong: setup, configuration, local iteration, framework communication, and packaging.
AI Can Help With the First Draft
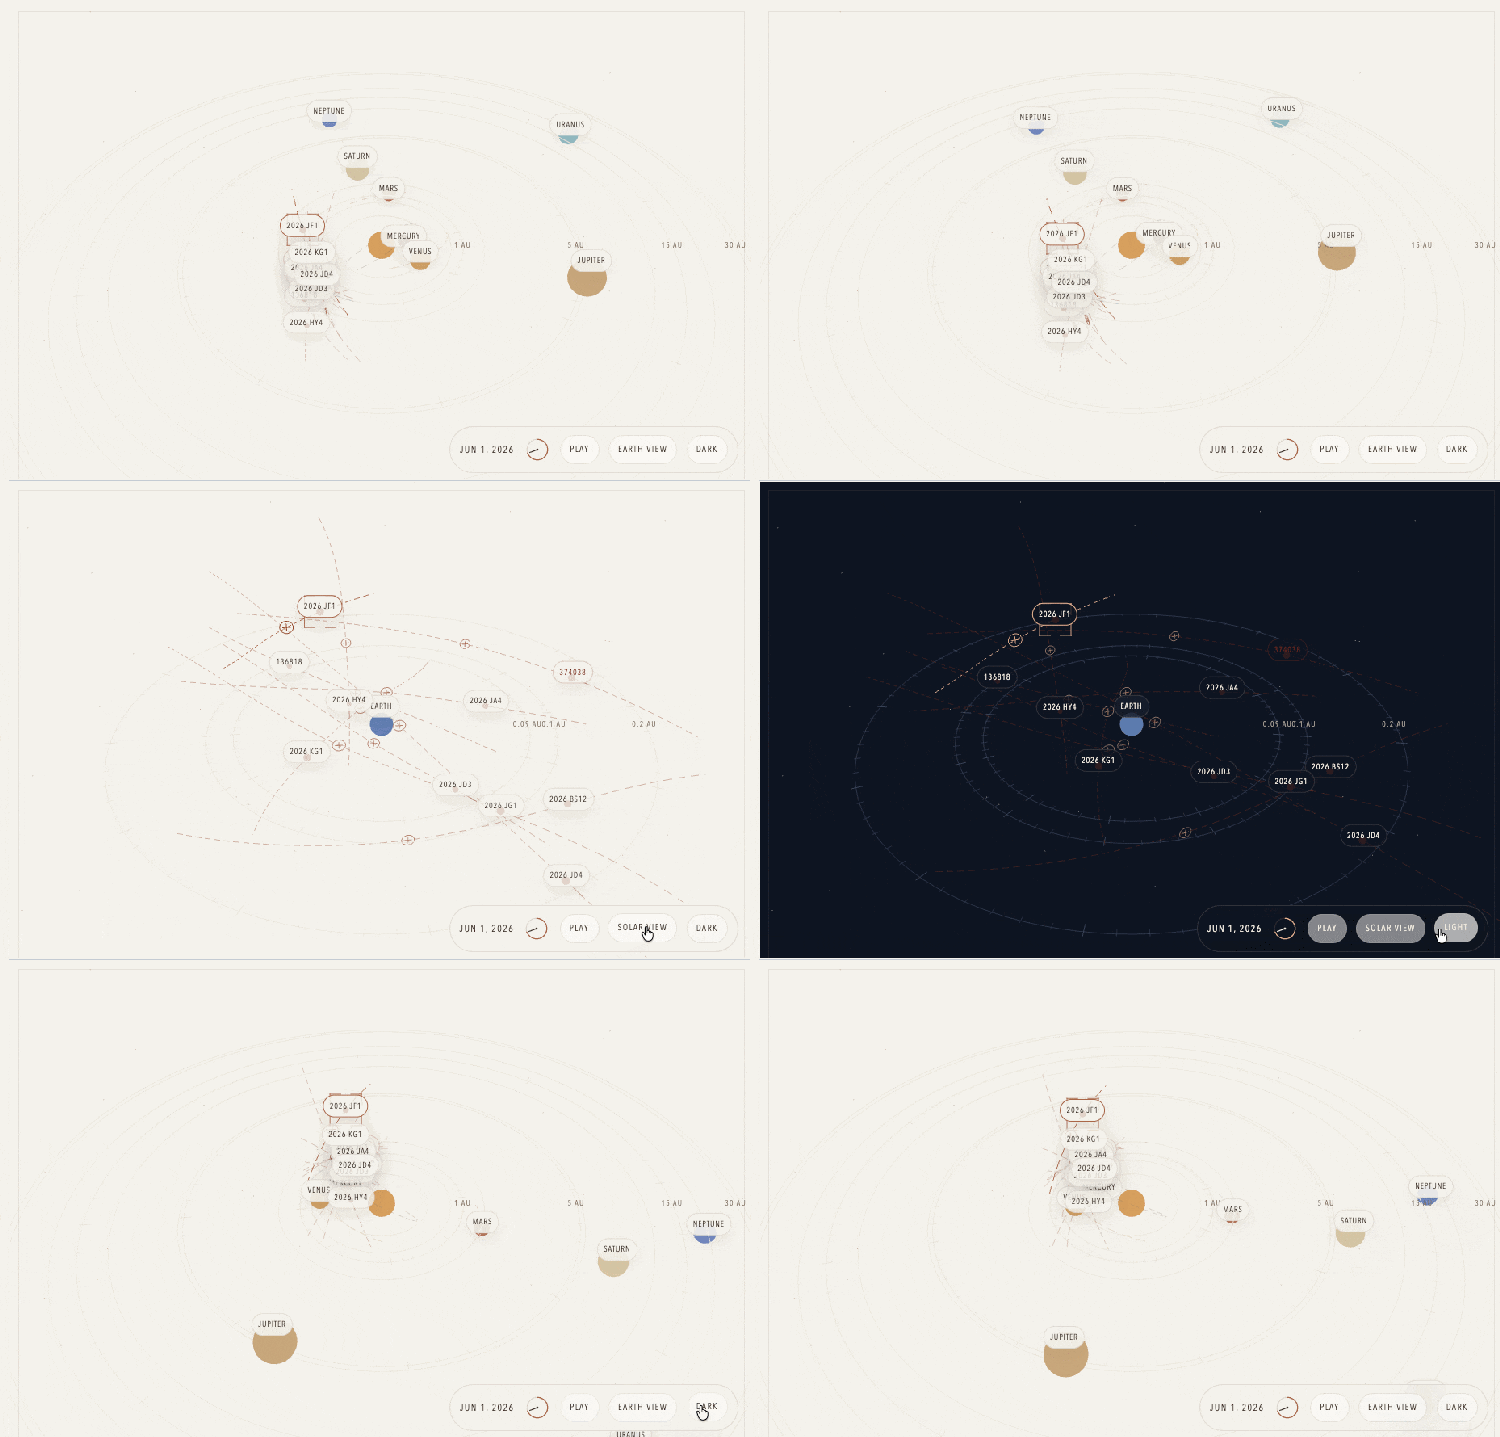
At Splunk Developer Day 2026, Thomas Payton showed a custom visualization built with AI: a video game match replay inside a Splunk dashboard, driven by a single SPL search and rendered as a React-based custom visualization. We've packaged this into a reusable AI skill for building custom visualizations. You describe what you want, provide the expected data shape, and the skill helps scaffold, implement, build, and package the visualization. You can find the custom-visualization-builder AI skill in Splunk Agent Skills. Below is another custom visualization created with the custom-visualization-builder skill.
What Will You Build First?
If you are starting from scratch, pick a visualization with a clear data contract and a clear reason to exist. Some ideas include:
- A risk matrix for security, compliance, or operational prioritization.
- A floor plan, asset map, or IoT status display.
- A custom health indicator for a service, device, or business process.
This is also a good moment to look at your existing Classic dashboard custom visualizations. We recommend rebuilding important custom visualizations with the new framework.
Helpful Resources
-
Dashboard Studio + Custom Visualizations Splunk Developer Day 2026 presentation
-
Create custom visualizations for Dashboard Studio with the Splunk dashboard extension CLI
-
Splunk Agent Skills: custom-visualization-builder skill
-
NPM packages:
Related Articles

Streamlining Vulnerability Management with Splunk Phantom

The Lessons Learned in Cybersecurity 25 Years Ago Are Still Applicable to AI Today