KubeCon 2025 London: OpenTelemetry Steals the Show and Splunk’s Bold Moves
I was lucky enough to attend KubeCon Europe 2025 in London, where the energy around OpenTelemetry (OTel) reached fever pitch. From packed sessions to buzzing hallway conversations, it’s clear: OpenTelemetry isn’t just the future—it’s the present. Here’s what stole the spotlight.
OpenTelemetry Hits Its Stride
1. CNCF Graduation Within Reach
OpenTelemetry has officially ticked all boxes for CNCF graduation, positioning it alongside Kubernetes as a cornerstone of cloud-native tech. The project’s maturity was underscored by milestones like:
- JavaScript SDK 2.0 and Go Auto-Instrumentation (Beta), which leverages eBPF for zero-code magic.
- Lambda Observability: Collector extensions now natively monitor AWS Lambda, closing a critical serverless gap.
2. Profiling Joins the Observability Pantheon
Profiling is now OTel’s fourth pillar, alongside logs, metrics, and traces. With OTLP 1.30.0:
- The Collector supports profiling across 12 components.
- The opentelemetry-ebpf-profiler repo enables low-overhead CPU profiling, a game-changer for performance tuning.
3. Structured Logging API
A new structured logging API is brewing, designed to unify client-side telemetry (RUM, browser metrics, GenAI logs). It’s poised to simplify correlation across frontend and backend.
Splunk Doubles Down on OpenTelemetry
Amid the OTel frenzy, Splunk made waves with announcements that cement its role as an OpenTelemetry powerhouse
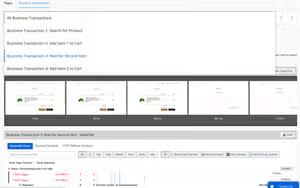
1. Service Inventory: Observability on Autopilot
Splunk’s Service Inventory tackles the chaos of large-scale environments by:
- Automatically discovering third-party apps (databases, message queues).
- Guiding users through OTel configuration with step-by-step recommendations.
- Flagging instrumentation gaps to eliminate blind spots.
Morgan McLean, OTel co-founder and Splunk PM, summed it up: “OpenTelemetry should be effortless—we’re making that a reality.”
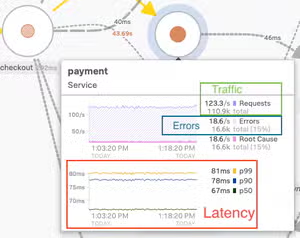
2. Kubernetes Troubleshooting Supercharged
Splunk unveiled enhanced Kubernetes monitoring to:
- Detect cluster issues faster.
- Reduce downtime with enriched visibility into pods, nodes, and deployments.
3. Language Support Expands
Python 2.0 and Node.js 3.0 SDKs landed, offering better flexibility and performance for cloud-native apps.
4. Cisco-Splunk Synergy
As part of Cisco, Splunk showcased native OTel support across its stack:
- Cisco ThousandEyes correlates network health with OTel metrics.
- Splunk AppDynamics ingests OTel traces, bridging APM and cloud-native observability.
Why This Matters
Walking the Expo floor, the message was clear: OpenTelemetry has won. Vendors aren’t just adopting it—they’re competing on how well they support it. Splunk’s innovations, paired with OTel’s meteoric growth, signal a turning point: observability is no longer a luxury but a scalable, open-source-first practice.
For engineers, this means fewer silos, less lock-in, and more time solving problems—not configuring tools. As one attendee told me, “It’s like watching the Kubernetes playbook repeat itself.”.
Want to Know More?
- Attend our webinar, 29 April, 10am BST: Troubleshooting Microservice Apps Faster with Splunk Observability Cloud
- Hear from our experts to learn How to Get Started With OpenTelemetry
- Test drive our Splunk Observability Cloud solution
- Visit our online resource: Splunk Solutions for OpenTelemetry
And if you want to know more about our latest news on Splunk’s OTel distribution you can watch this video recorded during KubeCon with TechStrongTV.
Thanks for reading!
Related Articles

Splunk Metrics via Telegraf
Don’t Know What to Monitor? L.E.T.S. Start with 4 Metrics!