Introducing Event iQ: Smarter Event Correlation in Splunk IT Service Intelligence (ITSI)
Every day, IT teams are flooded with alerts—thousands of messages about performance issues, service outages, or suspicious activity. With so many notifications, it’s easy to get overwhelmed, miss critical problems, or waste time chasing false alarms. Correlating related alerts into groups can help reduce the noise and make sense of everything, but setting up those correlations takes time, experience, and a lot of both system and historic knowledge. That’s where Event iQ in Splunk IT Service Intelligence (ITSI) comes in.
Alert Overload and Siloed Signals
Today’s IT environments are more complex than ever. Modern IT operations teams are tasked with ensuring the health of cloud services, on-premises infrastructure, network systems, and a growing stack of applications. With every new system, the number of alerts and notifications grows. On any given day, IT teams might receive hundreds, or even thousands, of alerts.
Most of these alerts don’t tell the full story on their own. Some are warning signs of a bigger issue, some are duplicates and many can result from poor alert hygene – a false positive due to a poorly set baseline or an alert set on something trivial that doesn’t affect the business. Without context, it’s impossible to know which alerts are urgent and which can wait. Teams often find themselves:
- Drowning in Noise: Critical alerts get lost in a sea of notifications, making it hard to separate the signal from the noise.
- Cross-domain Complexity: Consolidating data and managing alerts coming from multiple domains and disparate systems means navigating different tools and interfaces, slowing response and increasing operational risk.
- Wasting Valuable Time: IT staff spend hours manually sorting, reviewing, and correlating alerts—time that could be spent fixing real problems.
- Missing the Big Picture: When related alerts stay siloed, it’s difficult to see how seemingly isolated issues might be connected to a single root cause.
- Delaying Response: The longer it takes to triage and understand what’s happening, the longer it takes to restore normal operations, which can impact customers and the business.
This results in important issues going unnoticed until they escalate and teams bogged down chasing false positives or redundant notifications. As the pace and complexity of digital business increases, traditional, manual approaches to alert management just can’t keep up.
These related alerts can be grouped into events to help reduce alert noise. If you’ve heard of the category Gartner originally coined as AIOps recently renamed Event Intelligence, then this should all sound familiar. Grouping these alerts is a fantastic way to reduce alert noise and gain clarity into what is happening across the environment. The downside, is creating these correlations would often take a ton of time and even more in-depth knowledge of the environments, domains, and how their relationships. This is where Event iQ in Splunk ITSI can help.
Event iQ Automates Event Correlation
Event iQ uses AI to create the alert correlations that helps reduce alert noise. By grouping related alerts, highlighting critical incidents and adding the context teams need, issues can be understood and triaged faster. Event iQ’s power comes from AI. Instead of relying on rigid, manual rules, it learns from your actual data—finding patterns and ranking fields by importance. This means better accuracy, less manual work, and faster, more reliable incident response.

Here’s how it works:
- Significant reduction in manual effort and complexity: Automatically grouping related alerts reduces noise and additional context helps teams quickly understand the incident and determine next steps.
- Alert noise reduction for faster investigation: Automatically grouping related alerts, Event iQ reduces noise and additional context enables teams to immediately understand what an incident is about and quickly determine next steps.
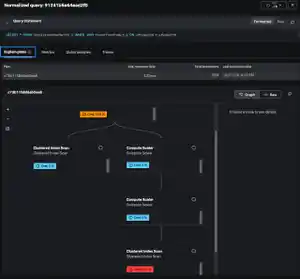
- Clarity and transparency: Dynamically generated titles and a plain text explanation of the correlation configuration helps teams easily understand why particular alerts were grouped.
- Smarter grouping: Event iQ analyzes your alert data, extracts and ranks the most relevant information, and groups related alerts together. These groupings are called “episodes.”
- Automated actions: Once episodes are created, you can set up rules to automatically respond—like closing resolved incidents or escalating critical ones.
Ready to quickly and easily cut through the noise and focus on what matters most?
Start using Event iQ in ITSI today and let AI help your team stay ahead of incidents, not buried in alerts.
Want to learn more? Check out the video below.
For more information and step-by-step instructions, visit the Splunk ITSI documentation.
Follow all the conversations coming out of #splunkconf25!
Related Articles

What the North Pole Can Teach Us About Digital Resilience

The Next Step in your Metric Data Optimization Starts Now

How to Manage Planned Downtime the Right Way, with Synthetics

Smart Alerting for Reliable Synthetics: Tune for Signal, Not Noise

How To Choose the Best Synthetic Test Locations

Advanced Network Traffic Analysis with Splunk and Isovalent

Conquer Complexity, Accelerate Resolution with the AI Troubleshooting Agent in Splunk Observability Cloud

Instrument OpenTelemetry for Non-Kubernetes Environments in One Simple Step
