Observability Blogs
Latest Articles
template
category
category
observability

How to Configure the Opentelemetry Collector to Begin Collecting Metrics
OpenTelemetry enables Observability, Learn how gathering metrics with OpenTelemetry is essential when building observable systems.

How to Simplify Your Out-of-the-Box Alerting with NEW! AutoDetect
AutoDetect provides out-of-the-box alerts for quick time to value. Get started in minutes to discover anomalies across the hybrid infrastructure within seconds.

The Five Tenets of Observability
Observability is essential for technology success. Learn the five key tenets of an Observability system and the benefits of Observability for your company.
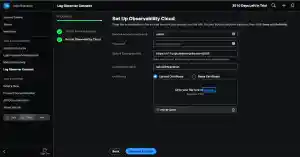
Splunk Enterprise Logs Now Available in Splunk Observability for Simplified Troubleshooting
Splunk Log Observer Connect for Splunk Enterprise, previewed at .conf21, is now generally available! Log Observer Connect lets observability users explore the data already being sent to existing Splunk instances with Splunk Log Observer’s intuitive no-code interface for faster troubleshooting and root-cause analysis.

Jenkins, OpenTelemetry, Observability
Leverage OpenTelemetry for Jenkins in Splunk Observability and monitor CI/CD performance.

Five Critical Insights You Won't Get With Your Cloud Provider's Monitoring Solution Alone
The blog provides 5 Insights into why Splunk is necessary to assure health of your multi-cloud estate and covers specific examples of the added value over individual cloud provider monitoring tools.
Splunk RUM Frontend Error Monitoring is Now Generally Available!
Splunk RUM Frontend Error Monitoring Helps engineering teams quickly scope, prioritize, and isolate their most impactful customer-facing JavaScript errors.
Enabling the Self Driving Cloud with Splunk Observability Cloud and GKE Autopilot
Announcing Splunk's Observability Cloud and OpenTelemetry upcoming support for GKE Autopilot

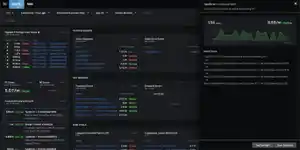
Announcing the GA of Splunk APM’s AlwaysOn Profiling
Splunk APM now includes AlwaysOn Profiling for Java applications, providing app developers and service owners continuous visibility of code level performance to troubleshoot production issues faster.