Operationalizing the NIST AI RMF in Splunk: Dashboard and Detection Framework
Security Rod Soto , Nasreddine BencherchaliStarting with Splunk Enterprise Security Content Update v6.9.0, an Alpha dashboard highlights NIST AI Risk Management Framework (AI RMF) subcategories for which Splunk ESCU AI detections provide evidence. This mapping helps analysts use detection results to guide AI governance.
Why AI risk Needs a Coverage Map
Security teams are now asked a question more frequently: "How are we monitoring our AI Systems?" Answering this question requires more than simply deploying detections; it requires a framework that can guide AI security posture and defense. The new ESCU NIST AI RMF dashboard addresses that question with a lookup-driven view and grouping of these detections by framework categories.
It now maps 33 production ready ESCU detections across six AI providers to nine of the framework 72 subcategories, and a generator script keeps the mapping current as detections change.
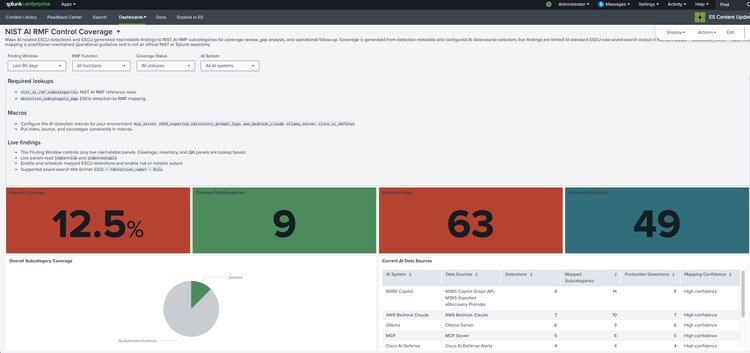
Figure 01 – ESCU NIST AI Dashboard Main Page
The Framework Overview of Categories
How Detections Get Mapped to Subcategories
The mapping is generated as the detections retrieve results and gets assigned to the subcategories with ordered regular-expression rules over the detection name, type, status, data source, and analytic story.
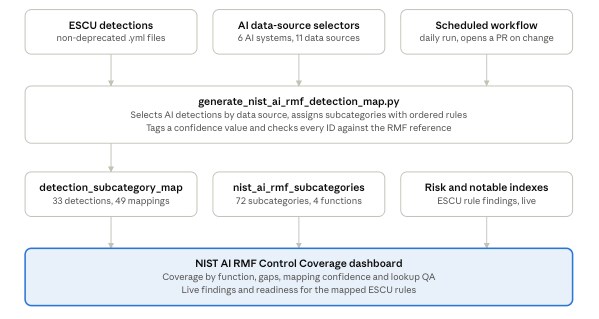
Figure 02 – Mapping Generation Flow
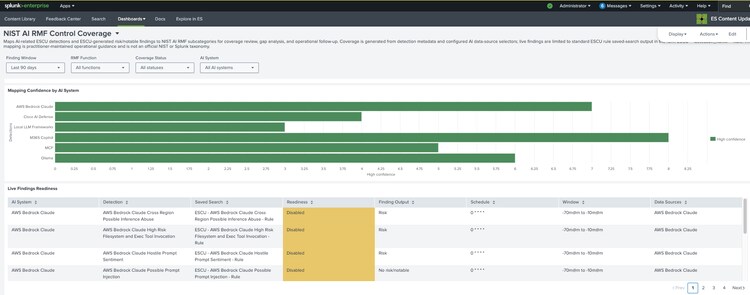
Examples of Specifics Mappings by Detections
A single detection can evidence several categories, a single prompt-injection detection for example supports both Measure 2.6 (safety) and Measure 2.7(security).
What the Dashboard Shows
The dashboard answers three questions in order:
- - Where do we have coverage?
- - How far can we trust the mapping?
- - Are any detections triggering?
It sits under Dashboards in the ESCU app navigation and has four global filters: Finding Window (default last 90 days), RMF Function, Coverage Status, and AI System.
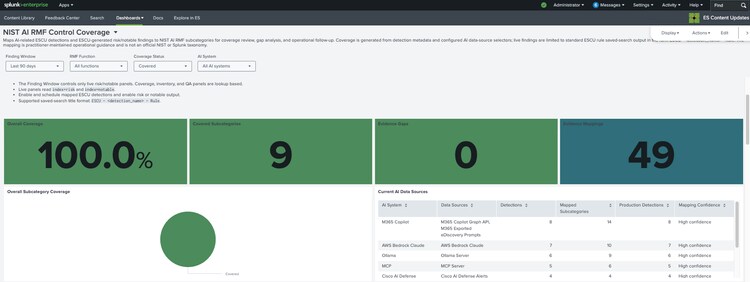
The coverage matrix scores each subcategory by its strongest evidence: 100 for a production detection, 80 for a high-confidence mapping, 60 for other mapped evidence and 0 for a gap. Every current mapping point at a production detection, so every covered subcategory scores 100.
Getting started
The dashboard needs two lookups, nist_ai_rmf_subcategories and detection_subcategory_map, both shipped with the content update. To get live findings rather than only coverage:
1. Point the AI detection macros at your data. Set the following macros with the index, source and sourcetype constraints for your environment.
- mcp_server
- m365_exported_ediscovery_prompt_logs
- aws_bedrock_claude
- ollama_server
- cisco_ai_defense
2. Enable and schedule the ESCU detections you want to track and turn on risk or notable output for them.
3. Open the dashboard and check Live Findings Readiness. Anything not marked Ready will not appear in the live panels.
4. Use the AI System and RMF Function filters to review one system or one function at a time.
Keeping the Mapping Current
A GitHub workflow regenerates the map every day at 06:25 UTC and opens a pull request when the output changes. When the CSV changes, the generator also increments the version and sets the modification_date in the lookup's metadata file, which Splunk needs to pick up lookup updates cleanly.
To preview a run yourself, install PyYAML and run the script from the repository root with --dry-run. It prints the CSV to the console and lists any mapping that needs manual review.
python scripts/nist_dashboard/generate_nist_ai_rmf_detection_map.py --dry-run
Adding an AI System
To cover a new technology, add an entry to scripts/nist_dashboard/nist_ai_rmf_data_sources.yml with a data source name, an ai_system label and, optionally, the analytic stories to restrict it to.
If the new detections need a signal, the existing rules do not recognize, add a rule to the script's ordered rule list with the subcategory IDs and a plain-language reason. The generator refuses to map to any subcategory that is not in the reference lookup, so a typo fails the run instead of polluting the dashboard.
What it Tells You, and What it Does Not
The dashboard turns "are we covered for AI risk?" into an answer you can review, filter and version, and today that answer is a modest one: the mapped detections touch 4 of the framework's 19 categories (Govern 1, Map 4, Measure 2 and Manage 4).
That is useful in two ways. For detection engineers, every gap is a prompt: a subcategory that logs could plausibly evidence, but no detection does yet. For governance teams, the gaps in GOVERN and MAP are a reminder that policy, roles and documentation need their own evidence, because telemetry will not supply it.
Two limits are worth keeping in mind. Coverage means a detection exists and is mapped, not that it is enabled in your environment, which is what Live Findings Readiness is for. And because the rules match detection, names, types, data sources and analytic stories, renaming a detection can change where it maps. The daily pull request and the review flag are there to catch that.
If you run AI workloads on Bedrock, Copilot, Ollama, MCP servers or local frameworks, make sure to the Splunk Enterprise Security Content Update v6.9.0 or later, enable the mapped detections and open the dashboard.
If your mapping disagrees with ours, or you have an AI data source we should add, we want to hear about it in the security_content repository on GitHub.
Please visit research.splunk.com for up-to-date AI security content.
Related Articles
The DarkSide of the Ransomware Pipeline

Splunk Partners with Singapore To Help Companies Enhance Cybersecurity