Splunking F1: Part One
Platform SplunkHere at Splunk, we are always on the lookout for new and exciting sources of data to get our hands on. When an opportunity to demonstrate Splunk to a prominent Formula One team came along, it really motivated us to search for a relevant data set to tailor the value of Splunk. The suggestion of Formula One racing simulators came from a conversation with an exemplary individual who I will refer to as Dave. Dave, a keen Formula One enthusiast, had identified a new capability in the F1 2016 PS4 game. After discovering telemetry data could be sent via UDP to third party applications, Dave had embarked on a personal project to consume and analyse this data in Splunk.
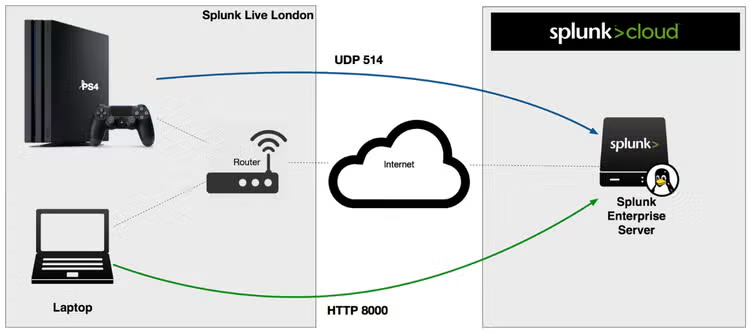
How it works
Racing simulators have evolved considerably in recent years, adding real-world variables such as fuel usage, damage, tyre properties, suspension settings and more. F1 2016 introduced the feature to expose such metrics via UDP to external devices such as D-BOX, motion platforms, steering wheels and LED devices. The game can be configured to broadcast real-time telemetry data every tenth of a second - equivalent to that of a real-world F1 car - to the local network subnet, or to send UDP traffic to a specific host and port. Each UDP packet sent includes a char array containing the telemetry data in binary format. Splunk as a machine data platform is well equipped to take advantage of the plethora of data on offer, thus providing the basis for an exciting new analytics project.
Any data can be brought into Splunk, but it needs to be in a textual, human readable format for us to comprehend it. To intercept and decode the UDP traffic, we implemented a simple Splunk modular input to listen on a socket, unpack the char array, reformat the data as CSV, and write it to Splunk via the Python SDK. CSV is particularly efficient as it minimises the raw event size and Splunk can easily learn the context of the dataset.
We were able to save significant time and effort by using the Splunk Add-on Builder. The tool helps developers configure data inputs, create a setup page, and ensure adherence to best practices, rather than having to manually edit and manage Splunk configuration files. When building modular inputs, it provides a series of helper classes which further simplify the effort involved.
All in all, including the copious amounts of "testing" of the F1 2016 game, we completed the data ingestion component of the project within a day. We will be publishing the TA on Splunkbase in the near future; in the meantime the source is available on Github.
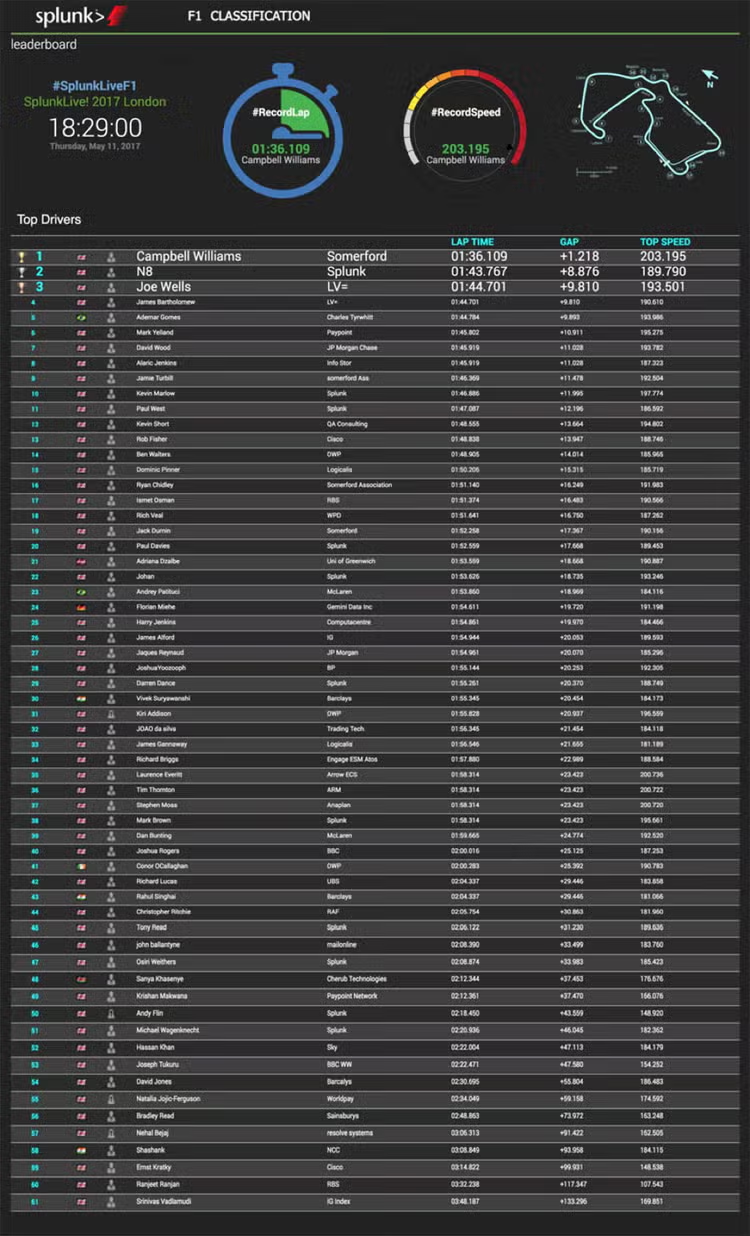
Splunk Live! F1 Challenge London
As with many types of data in Splunk, you typically find that the same data can be used in a variety of different ways, and for different audiences - each use case defined by the lens we place on the data. Our project commenced as a straightforward demonstration of real-time ingestion of the F1 telemetry data, with a sequence of dashboards to analyse the race data. The opportunity then presented itself to use the F1 data for a different purpose at this year's SplunkLive! London and Paris events.
Stay tuned for part two of this blog to discover how the data unravelled the unlikely event of a tie at SplunkLive! London.
----------------------------------------------------
Thanks!
Jon Varley
Related Articles
Announcing the General Availability of Cloud Monitoring Console’s Maintenance Dashboard

Monitoring Bucket Health in Splunk Enterprise