The Next Phase of OpenTelemetry: From Application Signals to Operational Context
Observability Courtney GannonKey takeaways
- OpenTelemetry is moving beyond cloud-native application instrumentation to connect enterprise messaging, networks, mainframes, and heterogeneous infrastructure.
- Recent Splunk OpenTelemetry innovations—including IBM MQ reaching general availability, new packaging, faster disk queuing, and gNMI and YANG gRPC receivers—illustrate how the project is maturing in both reach and operational readiness.
- The next stage of observability is not collecting more signals. It is preserving context across system boundaries and turning that context into reliable human and automated action.
OpenTelemetry is growing beyond application monitoring into a common way to carry operational context across teams and systems. At Observability Summit Europe, my colleague Antoine Toulme is exploring that broader role in "OpenTelemetry Beyond Observability: Security, CI/CD, and Network Management." His talk looked at using OpenTelemetry with security events, deployment validation, and network device telemetry. Those use cases point to the same challenge: helping teams understand what’s happening across the full system, even when the work crosses domains. Here’s what that next phase means for OpenTelemetry.
The System Is Larger Than the Cluster
OpenTelemetry is often introduced as a way to instrument cloud-native applications. That is a useful place to start, but it is not where the hard observability problems end. A customer request may begin in a browser, cross an API gateway, move through Kubernetes services, wait in an enterprise queue, touch a mainframe system of record, and depend on a network path that no application team owns. The user experiences one transaction. The organization often sees several disconnected flows and requires several disconnected tools.
That gap is becoming more visible as teams modernize. Few enterprises get to replace every legacy system, rewrite every integration, or move every workload into a cluster. They need a way to understand the systems they have, while adopting the systems they want. The next phase of OpenTelemetry is therefore less about adding another dashboard and more about extending a common operational language across the boundaries that matter.
A Maturity Model for OpenTelemetry
A useful way to think about OpenTelemetry’s evolution is as a progression through four stages.
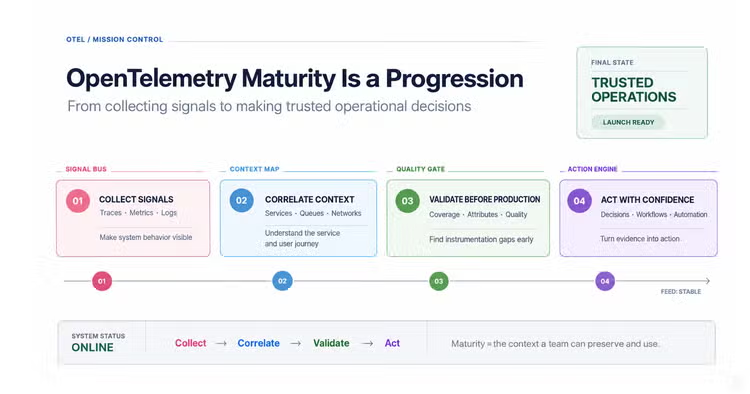
Many organizations have made progress on collection. The opportunity now is to make the other stages routine. That requires broader integrations, durable pipelines, and a sharper focus on the quality and meaning of telemetry—not just its volume.
Recent contributions from Splunk show what this expansion looks like in practice. IBM MQ support reaching general availability extends OpenTelemetry into enterprise messaging, while packaging improvements, faster disk queuing, and new gNMI and YANG/gRPC receivers strengthen the reach and reliability of telemetry pipelines. These are examples of a broader ecosystem—maintainers, users, vendors, and open-source communities—working together to make standardized telemetry useful across the systems enterprises depend on.
Enterprise Transactions Need Enterprise Context
Consider IBM MQ. Queues remain part of the critical path for many financial, retail, transportation, and government systems. A request that looks like a slow microservice call may actually be waiting on a message, a downstream transaction, or a system of record outside the Kubernetes environment.
With Splunk’s recent IBM MQ contribution reaching general availability, OpenTelemetry can more directly observe those enterprise transaction paths. The important outcome is not simply another integration. It is the ability to preserve context as work moves between modern services and long-lived systems. When that context is available, teams can investigate the business transaction instead of guessing which platform is responsible for the delay.
This aligns with the vision for OpenTelemetry. Maturity means meeting applications where they run, including environments with strict change controls, specialized protocols, and decades of operational knowledge. Mainframes and enterprise messaging are not exceptions to the observability story. They are part of the story.
Network Telemetry Joins the Conversation
The same principle applies to networks. Application teams may see increased latency, but the cause may be a path change, a device condition, a congested interface, or a service that is reachable but performing poorly from a particular location. Network teams have their own models and management protocols, and that information has historically lived apart from application telemetry.
Splunk’s recent gNMI and YANG gRPC receiver work creates a path for model-driven network telemetry to participate in OpenTelemetry pipelines. This matters because the goal is not to turn every network engineer into an application developer. The goal is to make network context available where cross-domain investigations happen, using a common transport and a shared operational workflow.
When application, infrastructure, and network signals can be correlated, the question changes from ‘Is the application or the network at fault?’ to ‘Which part of the end-to-end experience changed, and what evidence supports that conclusion?’ That is a more useful question for both humans and automation.
The Telemetry Pipeline Is Production Infrastructure
OpenTelemetry’s growth also changes the expectations placed on the Collector and its surrounding tooling. A pipeline that carries the evidence for an incident cannot be treated as an afterthought. It must be packaged, upgraded, monitored, and operated with the same discipline as other production infrastructure.
Recent Splunk packaging improvements and improved disk-backed queue performance address this operational reality. Telemetry systems need to continue ingesting data through temporary destination outages, absorb bursts without overwhelming applications, and catch up efficiently once the destination recovers. Reliable disk-backed queues help protect applications from backpressure while retaining telemetry for later delivery. These capabilities may not be visible in a service map, but they determine whether the service map can be trusted when an incident occurs.
OpenTelemetry is not only broadening what can be observed; it is improving the reliability of the machinery that makes observation possible.
Make Applications Observable by Design
Reliability also depends on when observability is addressed. If instrumentation is added only after an application reaches production, teams are likely to discover missing spans, inconsistent attributes, and unclear ownership at the worst possible time. The faster software is generated and deployed, the more expensive that retrofit becomes.
Observability Studio, a new open source project from Splunk, illustrates a different approach. Developers can inspect and validate OpenTelemetry data while they are building a service, then carry that high-quality telemetry into the environment where the service runs. This makes observability part of the development workflow rather than a separate operations task. It also supports a more portable model: teams can validate and improve the telemetry before deciding how and where they want to analyze it.
The practical idea is simple: an application should be observable from its first meaningful test, not from its first production incident.
From Shared Telemetry To Coordinated Action
OpenTelemetry is not an observability backend, and it doesn’t need to become one. Its value is that it provides a common foundation for the tools that analyze, visualize, and act on telemetry. The open standard can remain the connective tissue while different platforms provide different experiences for developers, SREs, network operators, and business owners.
Splunk’s role is both to contribute to the OpenTelemetry ecosystem and to build experiences that help customers use the resulting telemetry. Splunk Observability Cloud is one example of a platform built around this data foundation. Cisco Cloud Control points to another emerging layer: an operational control plane that brings information from observability, networking, security, and other systems into shared workflows. In that model, OpenTelemetry provides portable evidence, while the control plane helps teams apply context, policy, and action.
That distinction is important for a vendor-neutral conversation. Open standards do not eliminate differentiation. They move differentiation upward—from proprietary data capture toward analytics, workflow design, governance, and the quality of the operational experience.
The Work Ahead
OpenTelemetry has moved beyond the question of whether organizations will build on it. Many already rely on it to collect and move telemetry across their environments. The next challenge is making adoption easier, the developer and operator experience more consistent, and the remaining barriers to broader use easier to address. That means continuing to expand semantic conventions, supporting the systems that matter to enterprise transactions, improving the Collector’s operational behavior, and making instrumentation easier to validate and manage. Splunk’s recent contributions are examples of this work, alongside contributions from many other organizations and individuals across the project.
Broader adoption also depends on serving the people who operate different parts of the same system. Application developers, platform engineers, mainframe specialists, network operators, and SREs may use different tools and vocabulary today. OpenTelemetry can help connect those communities when the data carries enough context to be useful across each domain.
Conclusion
The future of OpenTelemetry is not simply a future with more integrations or more telemetry. It is a future in which telemetry can move across applications, enterprise middleware, networks, infrastructure, and operational platforms without losing meaning.
That is how OpenTelemetry moves beyond observability as a collection problem. It becomes part of the foundation for understanding complex systems—and for helping people and automated systems act on that understanding with confidence.
Want to talk about OpenTelemetry? Join Antoine and me every Monday at 8:30am PT/11:30am ET for Observability HQ when I lead an OpenTelemetry drop-in.
You can also meet me and the other Splunk maintainers and contributors at Kubecon North America in Salt Lake City in November. Pop into an Observability HQ and we’ll give you a 20% off discount code for Kubecon!
Related Articles

ShrinkLocker Malware: Abusing BitLocker to Lock Your Data

Macro ATT&CK for a TTP Snack
