One Collector, Three Views of Clock Synchronization: NPT, chrony, and PTP
Observability Antoine ToulmeKey takeaways
- NTP, chrony, and PTP receivers let teams monitor clock synchronization and catch time drift that can make logs and traces hard to line up.
- Each receiver measures a different source, so teams should match the receiver to the time service already running on their systems.
- The new PTP receiver, currently in development, checks whether a grandmaster clock is present and reports the offset when one exists.
When clocks drift, timestamps become harder to trust. An event can appear to precede its cause, and traces or logs from different hosts become difficult to line up. The Splunk OpenTelemetry Collector can help you observe time synchronization through three metrics receivers: NTP, chrony, and a new PTP receiver proposed in PR #8171.
Each receiver answers a different question. Choose the one that matches the time service running in your environment; use more than one when you need to compare perspectives.
Start With the Service You Already Run
The NTP receiver is a direct check against a configured server. It does not depend on chronyd being installed. Set endpoint to the server you want to measure. Its default collection interval is 30 minutes, and its configuration rejects shorter intervals. That makes it a periodic external reference rather than a high-frequency status feed.
If your host uses chrony, the chrony receiver reports what chronyd knows about its synchronization. It talks to the daemon's command socket and implements the equivalent of chronyc tracking without launching the chronyc executable. The default endpoint is unix:///var/run/chrony/chronyd.sock. Its default metrics include time correction, last offset, and skew; other tracking metrics can be enabled in the receiver configuration. The Collector needs access to the daemon endpoint. For a collector in a separate container, consult the receiver's file_mount_path guidance for a shared socket directory.
PTP serves environments that use linuxptp, often because they need to monitor synchronization of a PTP hardware clock. The new receiver runs pmc against a local ptp4l Unix socket and reads TIME_STATUS_NP. It reports whether a grandmaster is present and, when one is present, the offset of the PTP clock managed by ptp4l. That offset is not necessarily the host system clock offset. If no grandmaster is present, the receiver reports ptp.grandmaster.present = 0 and omits ptp.offset. The Collector process needs the pmc executable and access to the socket. The PTP receiver is currently in development in PR #8171; its proposed default interval is 10 seconds.
Configure the Receivers
This example enables all three to show their configuration side by side. In practice, include only the receivers whose endpoints are available on the host. Replace the example NTP endpoint with your own server and connect the metrics pipeline to your intended exporter.
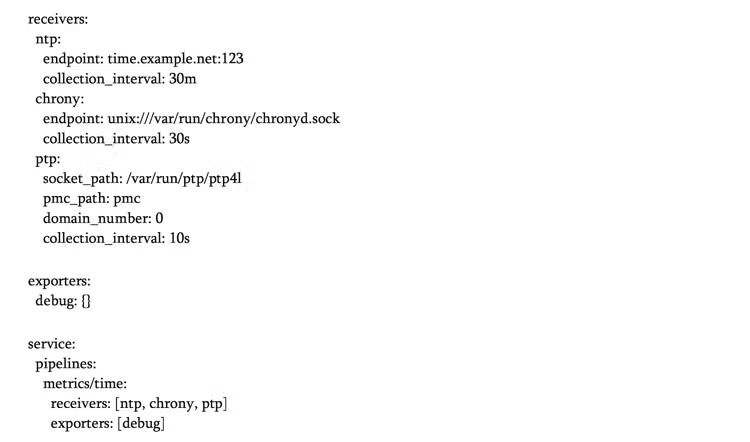
The metric names deliberately reflect their sources. A chrony metric's ntp. prefix does not mean it came from the NTP receiver. Likewise, an NTP server offset, chrony's view of the system clock, and a PTP clock offset should not be treated as interchangeable measurements. Check units before comparing or alerting: NTP and PTP offsets are in nanoseconds, while chrony's time correction and last offset are in seconds.
Together, these receivers let you watch a remote time reference, a local NTP discipline daemon, and a local PTP clock through the same Collector metrics pipeline. That makes clock health visible alongside the telemetry whose timestamps depend on it.
Next Steps
We are looking for candid feedback on this new proposal. We welcome comments on the PR itself, or you can join us every Monday at 8:30am PT/11:30am ET for Observability HQ for an OpenTelemetry drop-in.
You can also meet Splunk maintainers and contributors at Kubecon North America in Salt Lake City in November. Pop into an Observability HQ and we’ll give you a 20% off discount code for Kubecon!
Related Articles

Bypassing the Bypass: Detecting Okta Classic Application Sign-On Policy Evasion

Orchestrate Framework Controls to Support Security Operations with Splunk SOAR