Observability at Your Fingertips Directly From Splunk Platform—for Free
Observability Courtney GannonKey takeaways
- Bringing metrics and trace data alongside logs gives teams a more connected view of service health and richer context for finding the source of problems.
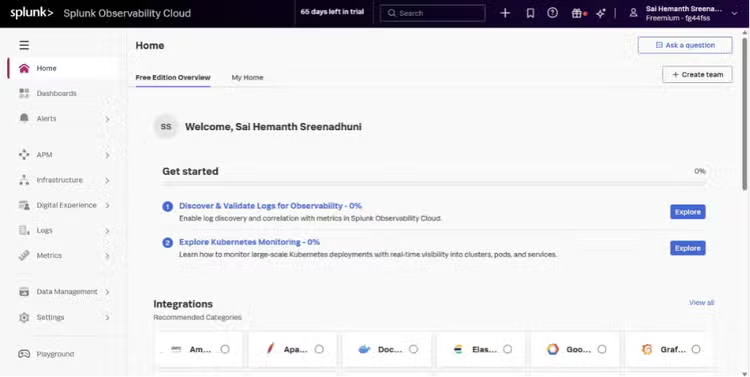
- Splunk Cloud administrators can provision a Free Edition organization of Splunk Observability Cloud directly from the Splunk Cloud interface using their existing identity.
- Splunk Enterprise customers can connect a Free Edition through Log Observer Connect or explore the Observability Cloud Playground to get familiar with the features.
At .conf, we announced our roadmap to bring observability foundations to Splunk Platform. Bringing metrics and trace data alongside the logs that teams already use will change how you investigate and resolve issues. Instead of troubleshooting through separate signals and workflows, you very soon you’ll be able to build a more connected view of service health, find the source of problems with richer context and coordinate response across roles.
Teams may need to adapt how they troubleshoot, but a more unified view of logs, metrics, and traces can help them move from spotting symptoms to finding causes and resolving issues across their environments. Splunk Cloud customers can take a first step to today: connect to Splunk Observability Cloud free edition directly from the Splunk Cloud UI and start exploring.
Starting From Splunk Cloud Directly From Your UI
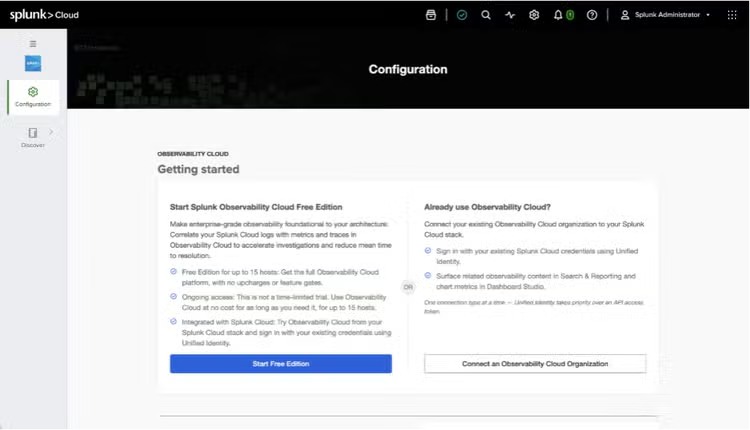
For Splunk Cloud users, getting started is designed to be straightforward. From the Splunk Cloud UI, admins can provision a Free Edition organization using their existing Splunk Cloud identity. They can check whether logs are available for selected observability use cases, then sign in to Observability Cloud with relevant “getting data in” options already configured.
This connected path makes it easier to move from discovery to hands-on exploration, using the Splunk Cloud experience you already know.
See What Observability Cloud Can Add
Observability Cloud can complement the log data and workflows Splunk customers already use. Logs provide detail about events; metrics help reveal changes in performance, and traces show how requests move across connected services.
Together, these signals can help teams:
- Understand service health from multiple perspectives. Combine detailed log events with performance trends and request paths across services.
- Investigate issues with more context. Connect service symptoms to the applications, infrastructure, and dependencies involved to help narrow down where to look.
- Monitor complex environments. Follow relationships across cloud infrastructure, containers, and distributed services.
- Build a shared view across teams. Give development, operations, and reliability teams common context for investigation and incident response.
The Free Edition provides a way to explore these capabilities and consider where observability could help your team.
Exploring From Splunk Enterprise
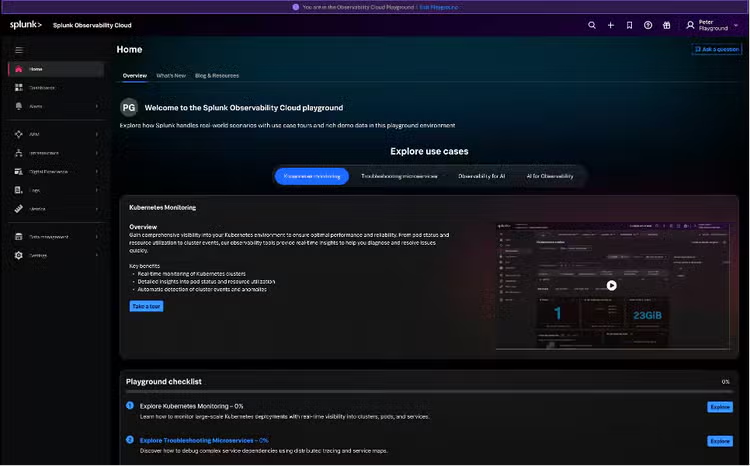
For Splunk Enterprise customers, you can connect your free edition through Log Observer Connect. You can find the instructions here. If you just want to check out the features and UI first, you can explore the Observability Cloud Playground to get familiar with the experience.
Get Help Getting Started
Want a hand with your first steps? Join Observability HQ, our weekly OpenTelemetry and Observability office hours. Join us every Monday at 8:30am PT/11:30am ET to ask questions and get help setting up and exploring Splunk Observability Cloud free edition.
Not a Splunk customer yet? Get your Free Edition of Observability Cloud here.
Related Articles

Ghost in the Web Shell: Introducing ShellSweep
Visual Link Analysis with Splunk: Part 2 - The Visual Part