Simplify OpenTelemetry Operations with the New Fleet Management UI
Observability Courtney GannonKey takeaways
-
Monitor OpenTelemetry agents and collectors in one place with a new Fleet Management UI that shows health, versions, configurations, and status.
-
View health, configuration, and diagnostic data together to identify telemetry collection issues and troubleshoot them more quickly.
-
Centralized visibility and APIs help teams manage large OpenTelemetry deployments, reduce configuration issues, and operate with greater confidence.
Managing OpenTelemetry at scale starts with answering a few deceptively simple questions: Which agents and collectors are running? Are they healthy? Which versions and configurations are they using? And when something goes wrong, what is causing the problem?
In our introduction to OpenTelemetry Fleet Management, we shared how Splunk Observability Cloud uses the Open Agent Management Protocol (OpAMP) to establish a centralized control plane for observability agents and collectors. This foundation gives teams a consistent way to retrieve inventory, health, version and configuration information across distributed environments.
Now, we’re making that information easier to explore and act on with a new Fleet Management experience in the Splunk Observability Cloud user interface.
From Fleet Management APIs to an Integrated UI
The first release of OpenTelemetry Fleet Management gave customers APIs for retrieving detailed inventory and effective configuration information. These APIs enable teams to incorporate fleet health checks into scripts, CI/CD pipelines, incident-response workflows and other automation.
The latest update brings that operational visibility directly into Splunk Observability Cloud. Teams can now use a dedicated UI to inspect registered OpenTelemetry Collectors and supported instrumentation agents without first creating their own API integrations.
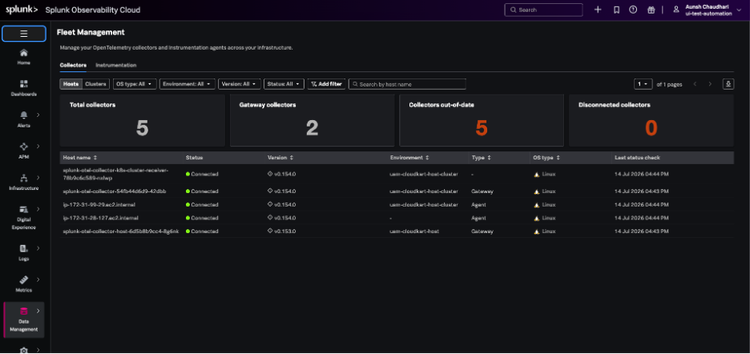
The experience is available from Data Management > Fleet Management, giving observability teams a central place to understand the software responsible for collecting telemetry across their environments—and to investigate problems when collection is disrupted.
See Your OpenTelemetry Fleet in One Place
Modern organizations can operate thousands of agents and collectors across Linux, Windows and Kubernetes environments. Without centralized inventory, it can be difficult to determine whether every component is present, healthy and configured as expected.
The Fleet Management UI helps teams answer those questions by surfacing important details about registered clients, including:
- Agent or Collector status
- Installed version
- Client and environment details
- Effective configuration
- Diagnostic signals from internal Collector metrics
This consolidated view helps teams identify unhealthy clients, find outdated versions and investigate inconsistencies without connecting to individual hosts or requesting access to application source code.
Move From Detection to Diagnosis
Knowing that a Collector is unhealthy is useful. Understanding why it is unhealthy is what helps teams restore telemetry quickly.
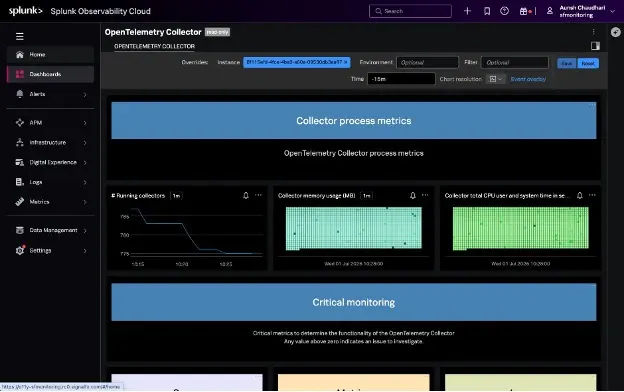
Fleet Management correlates inventory, configuration and health information with internal Collector metrics to provide additional diagnostic context. Instead of treating fleet status and Collector performance as separate sources of information, teams can use the combined view to investigate how a Collector is behaving and narrow down the likely source of a problem.
For example, a team investigating missing or delayed telemetry might need to determine whether the issue is caused by:
- A Collector that is unavailable or failing health checks
- An unexpected or invalid configuration
- A processor or exporter producing errors
- A buildup in queues or failed export attempts
- Resource pressure affecting Collector performance
- A version inconsistency across otherwise similar deployments
- A connectivity problem between a Collector and its destination
By correlating the Collector’s identity, version and effective configuration with its internal operational metrics, Fleet Management gives teams a more direct path from symptom to probable cause.
This reduces the need to move between disconnected tools, manually match a metric to a particular deployment or inspect hosts one at a time. It also helps teams distinguish an isolated Collector problem from a configuration or capacity issue affecting a larger part of the fleet.
Troubleshoot in Context
Collector issues are rarely solved by looking at a single signal. A high-level health state can indicate that something is wrong, but teams often need several pieces of context to understand what changed and what to do next.
The Fleet Management experience brings that context together so teams can ask questions such as:
- Is the affected Collector still connected and reporting?
- Which version is it running?
- What configuration is it actually using?
- Are similar Collectors reporting the same problem?
- Do its internal metrics show receiving, processing, queuing or exporting issues?
- Is the problem isolated to one host, or does it indicate a broader fleet-level pattern?
This contextual approach helps observability teams reduce investigation time and get closer to root cause before they connect to the underlying infrastructure.
It can also improve collaboration during an incident. Instead of handing another team a generic report that “telemetry is missing,” the observability team can provide more specific evidence about the affected component, configuration and stage of the collection pipeline.
Understand the Configuration That Is Actually Running
In a distributed environment, the intended configuration and the configuration running on an agent or Collector are not always the same.
A deployment might be updated only partially. An environment variable could override a default. A configuration file might differ between two otherwise similar hosts. When this happens, the resulting configuration drift can create gaps in telemetry or make troubleshooting unnecessarily difficult.
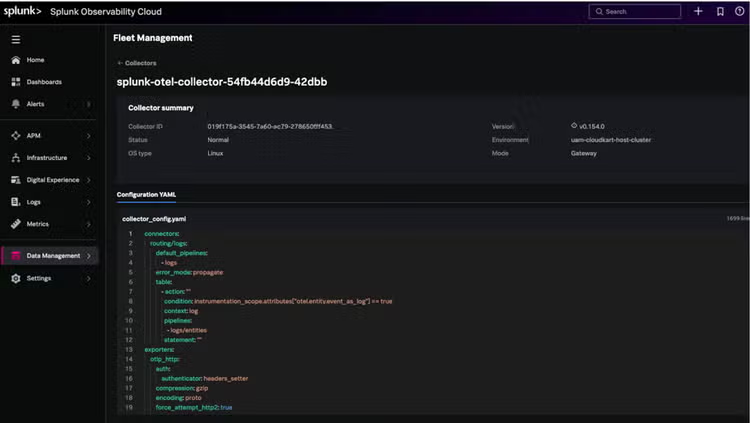
Fleet Management reports each client’s effective configuration—the settings the client is actually using. Bringing this information into the UI makes it easier to:
- Compare configurations while investigating inconsistent behavior
- Confirm that an agent or Collector registered with the expected settings
- Detect configuration drift across environments
- Audit the state of deployed observability components
- Verify changes without inspecting every host manually
- Correlate configuration differences with changes in Collector behavior
This gives central observability teams greater visibility while reducing their dependence on application teams for routine checks.
Support for Collectors and Instrumentation Agents
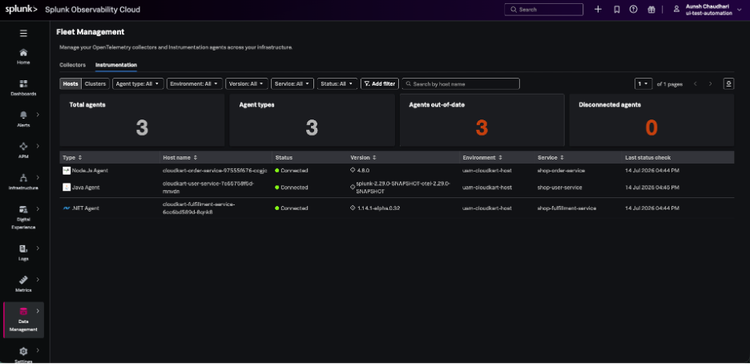
Fleet Management is designed to provide a unified inventory for the components that make up an OpenTelemetry deployment.
That includes the Splunk Distribution of the OpenTelemetry Collector, whether deployed in agent or gateway mode, as well as supported OpenTelemetry instrumentation agents. This broader inventory is important because reliable telemetry depends on the health and configuration of the entire collection path—not just one component.
Using OpAMP, registered clients report identity, capabilities, health, errors and effective configuration to the Fleet Management control plane. Telemetry continues to travel over the normal OpenTelemetry Protocol (OTLP) data path; management communication uses a separate OpAMP channel.
Separating these paths allows teams to monitor and manage their collection components without disrupting the flow of application and infrastructure telemetry.
A Better Foundation for Operating OpenTelemetry at Scale
The new UI is more than a presentation layer. It represents an important step toward making OpenTelemetry operations accessible to a broader group of users.
Developers and automation teams can continue using the Fleet Management APIs for programmatic workflows. At the same time, platform engineers and observability administrators can use the UI for interactive investigation, fleet reviews, troubleshooting and day-to-day operational checks.
Together, these interfaces help organizations:
- Reduce blind spots across large deployments
- Find unhealthy or misconfigured agents and Collectors faster
- Accelerate root-cause analysis of Collector issues
- Identify configuration drift and version inconsistencies
- Simplify audits and deployment validation
- Improve consistency across the telemetry estate
- Spend less time assembling diagnostic information manually
This is especially valuable for centralized observability teams that are responsible for telemetry collection standards but do not directly control every application or service.
Getting Started
To appear in Fleet Management, supported agents and Collectors must be configured to connect to the Splunk Observability Cloud Fleet Management service through OpAMP. The OpenTelemetry Collector can also provide the management path between supported language agents and the service.
Once the clients are enrolled and reporting, go to Data Management > Fleet Management in Splunk Observability Cloud to explore your inventory and investigate fleet health.For current prerequisites and configuration instructions, see Manage OpenTelemetry agents and collectors.
What’s Next
Centralized visibility is a fundamental requirement for operating observability agents at enterprise scale—but visibility alone is not enough. Teams also need to understand why collection components are unhealthy and how those issues affect the telemetry pipeline.
By bringing fleet status, versions, effective configurations and internal Collector metrics into a correlated experience, Splunk Observability Cloud helps teams move from detecting a problem to diagnosing its likely cause faster.
With APIs for automation and a UI for interactive operations and troubleshooting, OpenTelemetry Fleet Management helps teams understand their telemetry fleet, resolve Collector issues more efficiently and operate OpenTelemetry with greater confidence. These releases lay a strong foundation towards support for OpAMP based remote configuration and lifecycle management operations in the future.
Related Articles

Driving vSOC Detection with Machine Learning