Bring Logs Into Your Observability Workflow: Charting and Alerting in Splunk Observability Cloud
Observability Courtney GannonKey takeaways
- Teams can now build charts from log data right inside Splunk Observability Cloud, removing the need to switch between separate logging and monitoring tools.
- New AI-assisted log alerting helps teams write precise search queries, catch problems faster, and reduce unnecessary alert noise.
- Combining logs, metrics, and traces in one place cuts down on tool switching, helping teams resolve issues faster using skills they already have.
In today’s complex digital environments, the ability to quickly diagnose and resolve issues is the difference between a minor hiccup and a major outage. For many teams the path to resolution has been hindered by fragmented tooling. Historically, logs, metrics, and traces have lived in separate silos, forcing engineers to "swivel" between the Splunk Platform and Splunk Observability Cloud to get a complete picture of system health.
Today, we are excited to announce the integration of Logs-Based Charting and Logs-Based Alerting directly into the Splunk Observability Cloud. This evolution is designed to create a true "center of gravity" for your observability data, ensuring that every piece of the MELT (Metrics, Events, Logs, Traces) puzzle is accessible in one unified experience.
Breaking Down the Silos with Logs-Based Charting
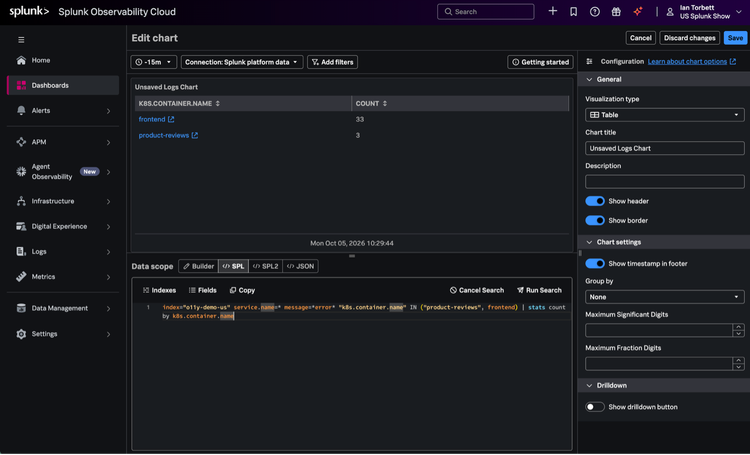
The struggle to visualize log data alongside performance metrics is a common bottleneck during troubleshooting. Our new logs-based charting feature removes this friction by allowing you to create log-based charts directly within the modern Splunk Observability Cloud dashboarding experience.
By bringing your logs into the same view as your metrics and traces, you gain a holistic understanding of your system’s behavior. You can now leverage your existing SPL and SPL2 expertise to visualize log data effectively, ensuring that you aren’t just looking at data—you are gaining actionable insights without ever leaving your primary observability dashboard.
Proactive Resolution with AI-Driven Logs-Based Alerting
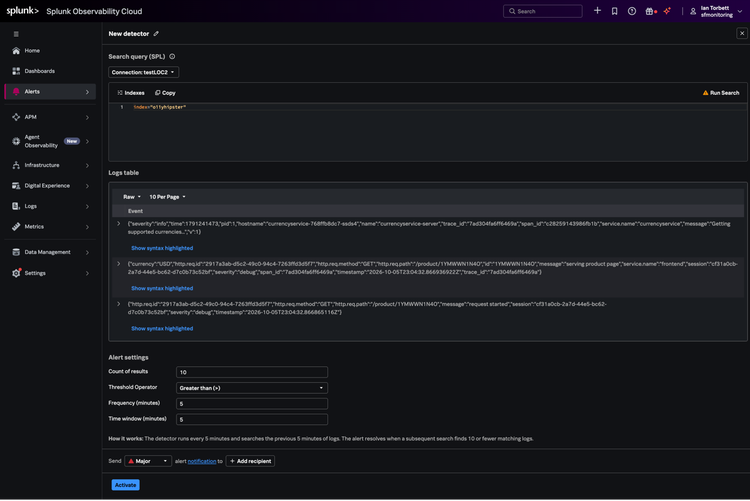
Visibility is only half the battle; the other half is knowing when something is wrong. Our new search-based log alerting feature bridges the gap between traditional log management and modern observability.
By integrating robust, search-based alerting directly into the Observability Cloud, we are empowering teams to:
- Reduce MTTD and MTTR: Catch critical log events in real-time, enabling faster detection and resolution of incidents.
- Leverage AI Assistance: Use AI-driven SPL assistance to craft effective, relevant queries, ensuring your alerts are precise and actionable.
- Minimize Alert Fatigue: By correlating logs with metrics and traces, you ensure that your alerts are context-rich, helping your team focus on the issues that truly matter.
Why This Matters for Your Team
This initiative is about more than just new features; it is about operational efficiency. By unifying your observability data, you reduce tool sprawl and eliminate the context-switching that slows down your incident response. Because this solution is built upon the foundation of SPL, your team can hit the ground running, utilizing their existing knowledge to drive immediate value.
We are committed to providing a seamless, integrated experience that empowers you to monitor, troubleshoot, and secure your environment with confidence. By bringing logs, metrics, and traces together, we are helping you spend less time navigating between tools and more time delivering exceptional digital experiences.
Ready to streamline your observability workflow? Explore the new logs-based capabilities in your Splunk Observability Cloud instance today. If you aren’t a Splunk Observability Cloud customer, try it out in the Playground! Explore best practices and core features immediately with pre-populated data. Try it now!
Related Articles

Introducing the PEAK Threat Hunting Framework
Visual Link Analysis with Splunk: Part 1 - Data Reduction