Bring the Power of SPL To Log Investigations in Splunk Observability Cloud
Observability Courtney GannonKey takeaways
- SPL search is now built into Logs Explorer, so filtering, grouping, and querying logs can switch smoothly between guided clicks and written SPL without losing context.
- Search results can be viewed as raw events, aggregated tables, or visual charts, and carried directly into chart-building tools for deeper analysis.
- Log-based alerting is arriving in September, making it easier to turn a log investigation into ongoing monitoring within Observability Cloud.
Log investigations often start with a simple question and quickly become more complex. You might begin by filtering for a service or error, then need to aggregate results, visualize a trend, build a chart, or turn what you found into an alert.
For teams that already know and trust Splunk Search Processing Language (SPL), that investigation can also mean moving between Splunk Observability Cloud and Splunk Cloud just to use the query language they rely on.
We’re changing that.
Splunk Observability Cloud is introducing an SPL search experience directly in Logs Explorer, bringing powerful, familiar Splunk search capabilities into the observability investigation workflow.
With the new experience, you can move between guided point-and-click exploration and SPL, view results as events, tables, or visualizations, and carry your search directly into charting workflows—all without leaving Observability Cloud. Log-based alerting will be available in September.
Search Logs in the Language You Already Know
Logs Explorer now brings SPL into the core search experience with an editable query bar designed to be consistent with log charting experiences across Observability Cloud.
If you know SPL, you can start writing queries directly. If you prefer guided exploration, you can continue using point-and-click controls for common operations such as selecting an index, applying filters, grouping results, and creating supported transformations.
The important part is that these aren't two disconnected ways to search.
As you build a query using point-and-click controls, Logs Explorer translates those selections into SPL in context. For example, you could select the app_logs index, filter to service.name=checkout, and create a time chart. The corresponding search is represented directly in the query experience:
index=app_logs service.name=checkout | timechart count
This makes it easier to start with guided exploration, understand the query being constructed, and move into SPL when you need more control.
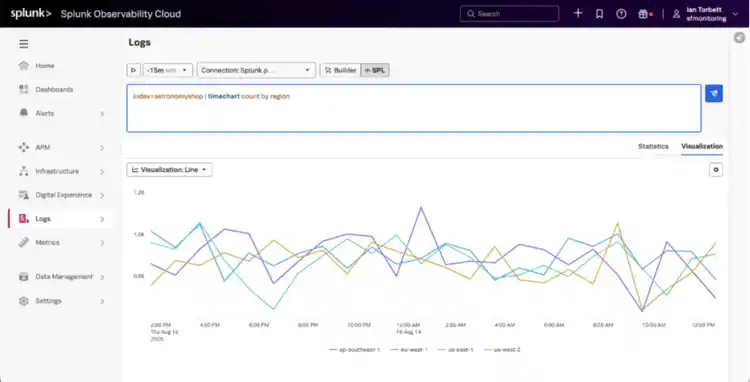
Move From Guided Exploration To Advanced SPL
For supported searches, you can move between point-and-click and SPL while keeping your search context synchronized.
The guided experience supports a common search grammar built around indexes, filters, grouping, and timechart and stats transformations. As long as your query stays within those capabilities, you can switch between the two experiences without rebuilding your investigation.
But SPL can take you much further.
When you add advanced SPL that can't be represented by the guided experience—for example, an eval, join, subsearch, or another unsupported transformation—Logs Explorer preserves your SPL query and keeps you in SPL mode.
Rather than silently dropping part of your search to make it fit the point-and-click experience, Logs Explorer tells you that the query contains advanced SPL and lets you continue editing it there.
The result is a simple principle: your SPL is never silently lost.
Turn Search Results Into Answers
Searching is only part of an investigation. How you look at the results matters too.
The new Logs Explorer experience supports three ways to work with search results:
- Events for inspecting individual log records.
- Tables for working with aggregated results, including output from stats.
- Visualizations for understanding trends and patterns, including output from timechart.
Visualization options are aligned with the log charting experience, so you can work with familiar formats such as line, bar, column, area, pie, and heatmap visualizations.
That means a single investigation can evolve naturally from raw events to an aggregate table to a visualization without requiring you to start over in another tool.
Go From Investigation To Monitoring
Finding something important in your logs often leads to the next question: How do I keep watching this?
Logs Explorer makes that transition easier by carrying your search context into downstream Observability Cloud workflows.
With Open in chart builder, you can take the search you're investigating—including its index, filters, SPL, and time range—and continue working with it in the log charting experience. This replaces the previous Save as chart workflow and creates a more consistent path from exploration to visualization.
Search, investigation, visualization, and monitoring become parts of the same workflow.
One Log Investigation Experience
The addition of SPL to Logs Explorer is about more than adding a text box.
It's about reducing the boundaries between the ways observability teams work with logs.
Start with point-and-click when you want speed. See the SPL generated from your selections. Move into the query when you need more expressive power. Turn the results into a table or visualization. Then carry the same context into a chart or alert.
For Splunk users, that means the search language you already know becomes a first-class part of the Observability Cloud log investigation experience.
And it means more investigations can start—and stay—in Splunk Observability Cloud.
Not an existing Splunk Observability Cloud customer? No problem! Try it today. Sign up for your Free Edition of Splunk Observability Cloud. No timed trial. No gated features. No credit card required.
Related Articles

Explore the Splunk SOAR Adoption Maturity Model

Do Not Cross The 'RedLine' Stealer: Detections and Analysis