Assure Campus EVPN With Splunk Enterprise
Observability Igor ManassypovIf you work in security operations, IT service management, or platform engineering, you already use Splunk Enterprise to answer what broke and when. Enterprise campus networks pose a different question: is the distributed fabric healthy right now—and where do I look first when users report intermittent outages?
Modern headquarters, hospitals, and large retail sites increasingly run on BGP EVPN VXLAN fabrics: programmable layer-2/layer-3 segmentation across hundreds of switches. From the help desk, a single Wi-Fi or VLAN complaint can involve overlay tunnels, tenant VRFs, route reflectors, and border handoffs. The symptom rarely points at the root cause.
This article is an architecture design guide for Splunk Enterprise practitioners who may not live in CLI day-to-day. It explains what a campus fabric is, how Cisco Catalyst Center fits into the provisioning plane, why assuring overlay health is structurally difficult, and how to design a reference Build → Run → Assure model using an OpenTelemetry Collector with the YANG gRPC receiver and a campus_evpn_assurance Dashboard Studio app—so your NOC can reason about overlay health under incident pressure.
What Is an Enterprise Campus Fabric?
Think of a campus fabric as a distributed switching system rather than a bag of independent devices.
Splunk Enterprise does not replace the controller; it answers whether the runtime matches operational expectations across every node, in near real-time.
Cisco Catalyst Center: The Infrastructure Management Controller
Cisco Catalyst Center (formerly DNA Center) is Cisco’s network management and automation platform for enterprise campus and branch infrastructure. In practical terms, it is the infrastructure management controller responsible for onboarding Catalyst switches and wireless controllers, maintaining inventory, pushing configuration, and enforcing design consistency across sites.
For Splunk Enterprise practitioners, think of Cisco Catalyst Center as the provisioning plane—the system that turns a network design into running Cisco Catalyst 9000 IOS-XE Operating System configuration on hardware. Understanding what it provisions is essential context for what Splunk Enterprise later assures at runtime.
In the context of this article, Cisco Catalyst Center automates three things that matter for overlay assurance:
Cisco Catalyst Center handles fabric and telemetry provisioning during deployment. This guide focuses on the Assure phase—the Splunk Enterprise metrics index, Dashboard Studio views, and SPL patterns that validate overlay health on top of that runtime.
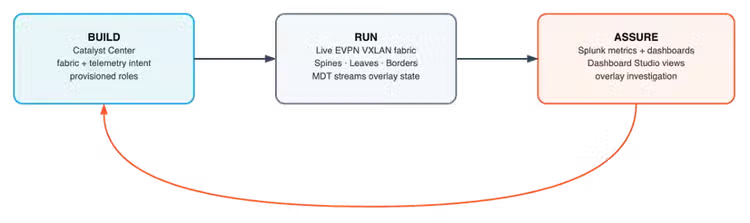
That separation is deliberate. Cisco Catalyst Center answers “is the fabric configured as designed?” Splunk Enterprise answers “is the fabric healthy right now—and where is the fault?” When assurance surfaces drift or recurring faults, those signals feed back into design updates in Catalyst Center—closing the loop illustrated in the lifecycle diagram below.
Why Assuring Campus Fabric Health Is Hard
Three structural gaps explain why traditional monitoring disappoints on overlay fabrics.
1. Symptoms are decoupled from causes. A user on VLAN 101 may report “network is slow” while the actual fault is a BGP EVPN session on a spine route reflector, a dropped NVE peer on a leaf, or a border tunnel that left oper-state. Tickets land on the wrong tier because L2/L3 complaints surface far from the control-plane event.
2. Failures are fast and transient. SNMP polling at five-minute intervals was designed for an era when network events outlasted the poll cycle. Campus EVPN fabrics on Catalyst 9000 hardware do not fail that slowly. A BGP session can leave Established, reconverge, and recover in thirty seconds. A VNI can drop oper-state for ninety seconds during a reconvergence storm. A VTEP peer can cycle while the access port still shows up. None of these events reliably appear on a five-minute dashboard fed by batch collection.
3. Scale multiplies blind spots. A modest campus may have dozens of leaves, multiple spines, two borders, hundreds of BGP neighbors, and thousands of VNI bindings. Manual CLI checks (show bgp l2vpn evpn summary, show nve peers, show l2vpn evpn mac) do not scale for continuous assurance - and they leave no durable evidence when the fault clears before an engineer logs in.
The data to catch these events already exists in Cisco Catalyst 9000 IOS-XE Operating System YANG operational models. The engineering problem is streaming it into Splunk Enterprise before the evidence disappears, then presenting it in a triage order operators can execute under incident pressure.
Reference Architecture Overview
The reference design separates provisioning from assurance across three phases:
- Build: Cisco Catalyst Center provisions fabric intent and MDT dial-out destinations.
- Run: Catalyst 9000 switches running the Cisco Catalyst 9000 IOS-XE Operating System stream overlay state continuously over gRPC.
- Assure: Splunk Enterprise indexes metrics and surfaces health through Dashboard Studio.
The open-source campus_evpn_assurance reference app illustrates this model with three Dashboard Studio views:
Platform Architecture
The assurance model rests on five cooperating layers:
evpn_assurance) and HTTP Event Collector (HEC) as the observability sinkCisco Model-Driven Telemetry and Yang
Before mapping overlay domains to Splunk Enterprise dimensions, it helps to understand the telemetry substrate: what Cisco Catalyst 9000 IOS-XE Operating System exports, how it is structured, and where to discover the paths that matter for campus EVPN assurance.
Model-Driven Telemetry (MDT) is Cisco’s streaming telemetry framework on the Cisco Catalyst 9000 IOS-XE Operating System. Instead of polling SNMP OIDs on a fixed interval, MDT pushes structured operational updates from the device to a collector as state changes—or on a configured period for counter-style data. For campus fabric assurance, MDT is the mechanism that makes sub-minute BGP flaps, VNI oper-state transitions, and VTEP peer loss visible in Splunk Enterprise before tickets escalate.
MDT subscriptions are defined against YANG (Yet Another Next Generation)—a data modeling language that describes both configuration and operational state on network devices. YANG models are hierarchical trees of containers, lists, and leaves. A subscription xpath filter (or equivalent path selector) names the subtree to stream—for example, all BGP neighbors under Cisco-IOS-XE-bgp-oper, or per-VNI state under Cisco-IOS-XE-nve-oper.
gRPC and gNMI – transport choices for network engineers. Both terms appear often in programmability discussions; they are related but not interchangeable.
gRPC (Google Remote Procedure Call) is a binary transport built on HTTP/2. In networking context it is the wire protocol—persistent, multiplexed streams between a client and server. For Cisco Catalyst 9000 IOS-XE Operating System Model-Driven Telemetry, the device acts as gRPC client in dial-out mode: each switch initiates outbound connections toward a collector and pushes telemetry on long-lived streams. Think of gRPC here as the delivery truck, not the cargo format inside the truck.
gNMI (gRPC Network Management Interface) is a management protocol standardized by OpenConfig that also runs over gRPC. gNMI defines RPCs such as Capabilities, Get, Set, and Subscribe with path selectors in gNMI path notation and encodings such as JSON IETF or protobuf. Tools like gnmic speak gNMI. gNMI is widely deployed on multivendor and routing platforms; it is the lingua franca when the goal is OpenConfig-aligned config and state across vendors.
The distinction matters when choosing the right methodology for collecting streaming telemetry:
Why this project uses Cisco MDT gRPC dial-out, not gNMI:
- Native oper models for campus EVPN. Overlay assurance depends on Cisco-native oper subtrees -
nve-peer-oper,BGP neighbor hold-time,evpn-statscontainer quirks—that are authored and validated underCisco-IOS-XE-*-opermodels, not OpenConfig equivalents. MDT xpath subscriptions target those trees directly. - Cisco Catalyst Center provisioning path. In a Catalyst Center-managed campus fabric, MDT dial-out subscriptions and collector destinations are part of deployment intent alongside BGP EVPN VXLAN roles. That is the supported operational model for Catalyst 9000 at scale.
- KV-GPB → Splunk Enterprise metrics pipeline. The YANG gRPC receiver decodes Cisco KV-GPB dial-out into OTLP and forwards to Splunk Enterprise HEC. A gNMI-based design would require a different collector stack, path mapping layer, and encoding translation before the same
cisco.encoding_path / mstatsmodel could be reused. - Dial-out fits fabric scale. Hundreds of leaves opening outbound gRPC sessions to a central collector avoids inbound connection storms and aligns with how Cisco Catalyst 9000 IOS-XE Operating System MDT is deployed in production campus designs.
gNMI remains the right tool when the objective is multivendor OpenConfig consistency or config push/validate workflows. For Cisco campus EVPN overlay assurance into Splunk Enterprise, native MDT over gRPC is the deliberate transport and encoding choice.
Two distinctions matter for this architecture:
*-oper) vs configuration (*-cfg) modelsOn the Cisco Catalyst 9000 IOS-XE Operating System, configured dial-out subscriptions use the yang-push stream with KV-GPB (Key-Value Google Protocol Buffers) encoding over gRPC—the format the YANG gRPC receiver decodes into OTLP metrics. The path that identifies each streamed subtree becomes cisco.encoding_path in Splunk Enterprise - the primary filter dimension when writing mstats queries.
Cisco publishes Cisco Catalyst 9000 IOS-XE Operating System YANG modules in public repositories such as YangModels/yang and the searchable YANG Catalog. Cisco Catalyst 9000 IOS-XE Operating System programmability documentation covers MDT subscription mechanics in full: Model-Driven Telemetry - Cisco IOS XE Programmability Configuration Guide.
YANG Suite (DevNet) is the lab tool for browsing oper models, extracting xpath filters, and validating subscriptions before dial-out. The step-by-step workflow for campus EVPN paths is in Discovering the XPath for MDT subscriptions.
Splunk Enterprise is the assurance and triage layer on top: engineers define which oper leaves prove overlay health in YANG Suite, provision those paths through Cisco Catalyst Center, and query the resulting metrics in Dashboard Studio.
Telemetry Model: Yang Paths and Operational Domains
MDT streams Cisco Catalyst 9000 IOS-XE Operating System operational state—not config—into Splunk Enterprise as metrics. Device identity in Splunk Enterprise is cisco.node_id. A lookup table (evpn_device_inventory) enriches metrics with site and fabric role (leaf / spine / border) so dashboards roll up by topology, not IP address.
Assurance KPIs
These KPIs translate fabric concepts into Splunk Enterprise metrics queryable with mstats:
Discovering the XPath for MDT Subscriptions
The filter xpath in a Cisco Catalyst 9000 IOS-XE Operating System telemetry subscription is a design decision—not a guess. Stream too narrow a subtree and you miss overlay faults; stream too wide and you flood the collector with irrelevant leaves. Before any xpath appears in CLI, Cisco Catalyst Center intent, or Splunk Enterprise cisco.encoding_path filters, a network engineer must answer: which YANG oper subtree carries the state I need to assure?
Cisco YANG Suite is the reference tool for that discovery workflow. YANG Suite does not replace Splunk Enterprise—it helps engineers navigate Cisco Catalyst 9000 IOS-XE Operating System oper models, extract the correct xpath filter, and validate that the subscription returns the expected data before production dial-out is aimed at an OpenTelemetry collector.
Step 1: Map the Operational Question to a Yang Module
Start from the CLI mental model, not from Splunk Enterprise field names. For VTEP peer adjacency - the walkthrough in the next section - the operator question is equivalent to show nve peers. That maps to the Cisco-IOS-XE-nve-oper oper model and the nve-peer-oper list (keys: remote VTEP loopback in peer-addr; leaves: peer-state, cp-vnis, child peer-vni-group, and so on).
Load the module revision that matches your Cisco Catalyst 9000 IOS-XE Operating System software image - from YangModels/yang or by downloading supported models from a lab device into YANG Suite (Setup → YANG files and repositories), then group them in a YANG module set (Setup → YANG module sets) aligned to your Catalyst 9000 platform.
If Cisco-IOS-XE-nve-oper is missing from the Explore module picker (you may see evpn-oper, bgp-oper, and interfaces-oper but no nve-oper): check Setup → YANG module sets first - the .yang file may already be in the repository but not included in the module set selected during initial setup. Edit the campus set, add Cisco-IOS-XE-nve-oper, save, then reload Explore → YANG. It should appear alphabetically between native and ospfv3.
Only if the file is absent from the repository: upload Cisco-IOS-XE-nve-oper.yang (Setup → YANG files and repositories) or download from a leaf/border device profile, then add to the module set.
evpn-oper is not a substitute - VTEP adjacency (nve-peer-oper) lives only under nve-oper.
Step 2: Browse the Oper Tree in Yang Suite
Open Explore → YANG, select the module set, and load Cisco-IOS-XE-nve-oper. Expand the tree until you reach the list that mirrors the CLI table:
nve-oper-data
└── nve-oper
├── nve-vni-oper ← per-VNI state
├── nve-peer-oper ← VTEP adjacency (peer-addr key)
│ └── peer-vni-group ← per-peer VNI bindings
└── …
Confirm three things before copying an xpath:
- Oper, not config - the leaf lives under an
*-opermodel, not*-cfg. - List keys - note which leaves identify each row (
peer-addrfornve-peer-oper;these become Splunk Enterprise dimensions after collection). - Subtree scope - subscribing at
nve-peer-operincludes all child lists; subscribing atnve-operincludes peers, VNIs, and global NVE counters in one wider push (usually too broad for on-change peer events alone).
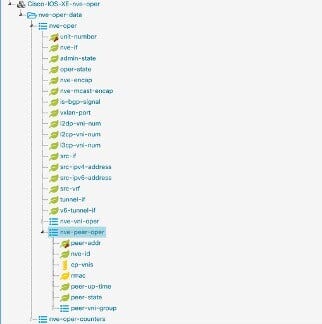
YANG Suite - Explore YANG tree at nve-peer-oper.Explore → YANG: Cisco-IOS-XE-nve-oper expanded to nve-peer-oper - the list that carries VTEP adjacency state.
Step 3 - Extract the XPath From Node Properties
Right-click the target node (nve-peer-oper) and choose Properties. YANG Suite displays two fields that together define the filter:
Cisco documents this workflow in Configure Model-driven Telemetry on Cisco IOS-XE Devices with YANG Suite under Steps to Obtain the XPath Filter.
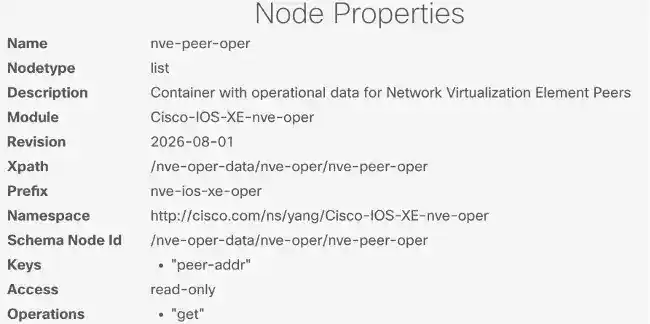
YANG Suite - xpath Properties dialog.Right-click → Properties on nve-peer-oper: Prefixand XPathdefine the subscription filter.
Step 4: Translate to Cisco Catalyst 9000 IOS-XE Operating System Telemetry Filter Syntax
Cisco Catalyst 9000 IOS-XE Operating System configured dial-out subscriptions (telemetry ietf subscription …) use an xpath filter in a device-native form that often omits the module prefix seen in NETCONF examples. For campus EVPN assurance, the peer-adjacency filter is:
filter xpath /nve-oper-data/nve-oper/nve-peer-oper
not a prefixed path such as /nve-oper-ios-xe-oper:… unless your Cisco Catalyst 9000 IOS-XE Operating System release and subscription type explicitly require it. If show telemetry ietf subscription <id> detail reports Invalid with an xpath parse error, compare the filter against the Properties dialog and the Cisco MDT programmability guide—a missing segment or an extra / after the prefix is the most common failure mode.
Three xpath forms appear in the end-to-end design; engineers must not conflate them:
The OpenTelemetry collector maps KV-GPB encoding_path to the Splunk Enterprise form—that is what assurance dashboards query. The engineer’s job in YANG Suite is to land the device xpath correctly; Splunk Enterprise inherits the encoding path automatically once telemetry flows.
Step 5: Validate Before Aiming Dial-Out at Splunk Enterprise
YANG Suite offers two lab validation paths before production traffic hits the OpenTelemetry collector:
NETCONF explore (dial-in) - Protocols → NETCONF: load the oper module, run get/get-oper against a lab leaf, and confirm nve-peer-oper returns peer-state and peer-addr rows that match show nve peers. This proves the xpath selects the right subtree without configuring dial-out.
gRPC telemetry receiver (dial-out sample) - Protocols → gRPC Telemetry: start a local receiver, then use Protocols → NETCONF with Cisco-IOS-XE-mdt-cfg to build an edit-config RPC that programs a test dial-out subscription (stream yang-push, encoding encode-kvgpb, xpath-filter, receiver pointing at YANG Suite). Cisco documents this flow in the same MDT + YANG Suite guide under Configure a Periodic Configured Subscription with YANG Suite.
On the device, confirm the subscription is Valid and the gRPC session is Connected:
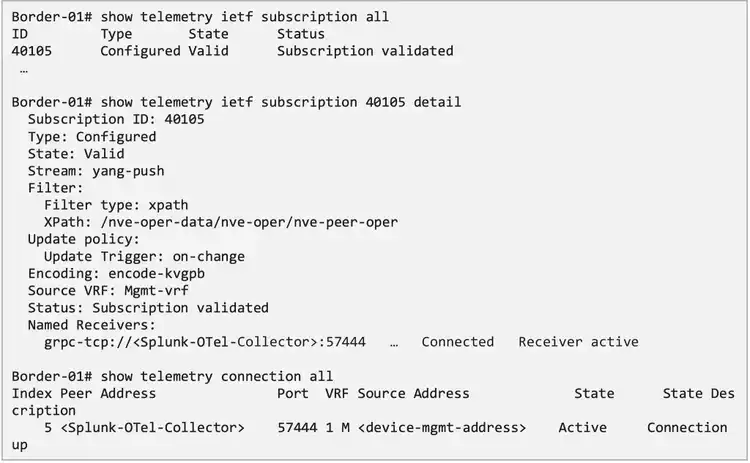
The 57444 row in Mgmt-vrf (VRF column 1 M) is the fabric MDT dial-out toward the OpenTelemetry collector. Additional Active connections (for example Cisco Catalyst Center Assurance on another peer/port) are normal on managed devices - they are not the Splunk Enterprise assurance path.
show telemetry internal connection requires a connection index on this Cisco Catalyst 9000 IOS-XE Operating System release; show telemetry connection all is the practical session-level check.
Only after xpath discovery and validation should the same filter be promoted to production dial-out toward the OpenTelemetry collector. The sections that follow walk through one fabric event end-to-end, then describe the Splunk Enterprise ingestion model and dashboard triage design.
A Day in the Life of a Fabric Event
With xpath filters defined and validated, follow one overlay event from the Catalyst 9000 data plane through to a Splunk Enterprise metrics series—a VTEP peer state change on a leaf switch. This is the class of fault that drives intermittent campus complaints: overlay adjacency drops, users on affected VNIs lose east-west reachability, and the event often clears before the next SNMP poll cycle.
Scenario: Leaf-01 loses NVE adjacency to remote VTEP Leaf-02 (Leaf-02 Loopback) during a maintenance window on the peer leaf, an access-side failure, or EVPN route withdrawal. The peer row in show nve peers transitions from UP to DOWN.
In a typical campus design, spines act as BGP route reflectors—they are not VTEPs. NVE peer adjacency exists between VTEP-capable nodes (leaves and borders) that share overlay segments, not between a leaf and a spine.
1. Event Origin on the Cisco Catalyst 9000 IOS-XE Operating System
On a BGP EVPN VXLAN leaf, the NVE (Network Virtualization Edge) process maintains VXLAN tunnel endpoints toward every remote VTEP (another leaf or border) that participates in shared VNIs. When underlay reachability to Leaf-02 Loopback fails, or when the remote VTEP withdraws EVPN routes, Cisco Catalyst 9000 IOS-XE Operating System updates the operational YANG tree under Cisco-IOS-XE-nve-oper - specifically the nve-peer-oper list keyed by peer-addr.
An operator would see the fault at the CLI:

In YANG terms, the list entry for Leaf-02 Loopback in peer-addr changes: the peer-state leaf moves from UP to DOWN, and control-plane VNI bindings under peer-vni-group may withdraw. This is operational state - not a configuration change—published by Cisco Catalyst 9000 IOS-XE Operating System’s telemetry agent (pubd) when the NVE control plane detects the transition. Cisco Catalyst 9000 IOS-XE Operating System can emit this change within seconds of the adjacency loss - fast enough for sub-minute assurance, unlike batch SNMP polling.
2. MDT Subscription on the Device
A configured dial-out subscription tells Cisco Catalyst 9000 IOS-XE Operating System which YANG subtree to stream, when to send updates, and where to send them. For VTEP peer adjacency, the reference design uses an on-change subscription against the nve-peer-oper xpath - so Cisco Catalyst 9000 IOS-XE Operating System pushes an update the moment peer state changes, not on the next periodic poll.
Representative Cisco Catalyst 9000 IOS-XE Operating System subscription stanza (abbreviated from the reference lab):

A companion periodic subscription on the same xpath provides heartbeat-style samples for trending even when no state change occurs—useful for detecting silent devices (no telemetry at all) versus a genuine all-peers-up steady state.
When peer-state flips on Leaf-01, subscription 40105 matches the xpath filter, packages the affected nve-peer-oper subtree, and initiates a gRPC dial-out session toward the collector.
3. On the Wire - gPRC Dial-Out to the OpenTelemetry Collector
Between Cisco Catalyst 9000 IOS-XE Operating System and Splunk Enterprise, the payload is not HEC JSON. The device opens a gRPC connection to the YANG gRPC receiver and sends an MDT dial-out message encoded as KV-GPB: a compact protobuf structure where each YANG list key becomes a key field and each leaf becomes a value field.
Conceptually, after KV-GPB decoding inside the collector, one peer-state transition looks like this (illustrative - field names match the decoded GPB structure):
"subscription_id": "40105",
"encoding_path": "Cisco-IOS-XE-nve-oper:nve-oper-data/nve-oper/nve-peer-oper",
"collection_id": "…",
"collection_start_time": "2026-07-09T14:32:18.412Z",
"msg_timestamp": "2026-07-09T14:32:18.415Z",
"values": [
{
"keys": { "peer-addr": "<peer-vtep-loopback>" },
"content": {
"peer-state": "DOWN",
"cp-vnis": 0
}
}
]
}
Key architectural points at this hop:
The YANG gRPC receiver decodes KV-GPB into OTLP inside the collector. OTLP is in-memory only - KV-GPB crosses the device-to-collector leg; HEC JSON crosses the collector-to-Splunk Enterprise leg.
4. Landing in the Splunk Enterprise Metrics Index
The collector’s Splunk HEC exporter translates OTLP metrics into HEC JSON and POSTs them to the evpn_assurance metrics index. Each peer-state transition produces one or more metric data points—not a traditional log event with a _raw field.
Representative structure as stored in Splunk Enterprise (simplified for readability):
{
"metric_name:cisco.cp-vnis.": 0.0,
"metric_name:cisco.peer-state_info": 1.0,
"cisco.node_id": "Leaf-01",
"cisco.encoding_path": "Cisco-IOS-XE-nve-oper:nve-oper-data/nve-oper/nve-peer-oper",
"cisco.subscription_id": "40105",
"peer-addr": "<peer-vtep-loopback>",
"value": "<ios-xe-peer-state-enum>",
"_time": 1720537938.415
}
Field-by-field semantics (metric names, dimensions, *_info enums, and enrichment macros) are defined in Splunk Enterprise metrics – nomenclature for this design.
5. Dashboard Triage Outcome
- Summary scorecards show a non-zero ▼ on VTEP peers or a drop in total peer count.
- Details (leaf role) isolates
Leaf-01and the Leaf-02 Loopback adjacency in the NVE Sankey. - Alerts surfaces a derived row if peer-down or telemetry-stale conditions match.
The same event—invisible to SNMP—is now durable evidence in Splunk Enterprise. Even if the peer reconverges thirty seconds later, the on-change push and the metrics time series preserve the flap for post-incident analysis. The end-to-end hop sequence (Cisco Catalyst 9000 IOS-XE Operating System → OpenTelemetry → HEC → Dashboard Studio) is shown in the pipeline diagram under Telemetry ingestion architecture.
Telemetry Ingestion Architecture
The pipeline connects Cisco Catalyst 9000 IOS-XE Operating System dial-out, OpenTelemetry decode, and Splunk Enterprise HEC ingest. In a Cisco Catalyst Center-managed fabric, subscriptions and collector destinations are part of deployment intent - the assurance layer should not depend on per-switch manual configuration.

Telemetry pipeline from Cisco Catalyst 9000 IOS-XE Operating System to Splunk Enterprise metrics.Cisco Catalyst 9000 IOS-XE Operating System MDT dial-out → OpenTelemetry Collector → Splunk Enterprise HEC → Dashboard Studio.
Splunk Enterprise Metrics: Nomenclature for This Design
Campus fabric assurance stores overlay state in a Splunk Enterprise metrics index—not a traditional events index. Understanding how Splunk Enterprise represents metrics is essential before reading dashboard SPL or designing new panels.
Metrics index vs events index. An events index stores searchable _raw text (syslog, SNMP traps, CLI captures). A metrics index stores time-series numeric data points. Each point has a timestamp, one or more metric names (the signals being measured), and dimensions (labels that slice the series). There is no meaningful _raw field for overlay oper-state in this design - BGP hold-time, VNI counts, and peer adjacency are queried as numbers over time.
Metric names. In HEC JSON and in SPL, metric names appear with a metric_name: prefix - for example metric_name:cisco.cp-vnis. or metric_name:cisco.negotiated-keepalive-timers.hold-time. The name encodes the YANG leaf path after OTel normalization: module prefix stripped, hierarchy joined with dots. In mstats, quote the name without the prefix:
| mstats latest("cisco.cp-vnis.") AS cp_vnis WHERE `evpn_index` …
Dimensions. Dimensions are string labels attached to every data point. They are how Splunk Enterprise separates one time series from another. In this architecture, dimensions fall into three layers:
cisco.encoding_path is the filter on the Splunk Enterprise side that corresponds to the Cisco Catalyst 9000 IOS-XE Operating System xpath—for example Cisco-IOS-XE-nve-oper:nve-oper-data/nve-oper/nve-peer-oper. Dashboards almost always scope mstats with an encoding_path match so BGP panels do not mix with NVE panels.
Enumeration leaves and *_info metrics. Splunk Enterprise metrics store numbers, not arbitrary strings. YANG enumeration leaves such as peer-state or oper-status are therefore emitted as companion *_info metrics (e.g. cisco.peer-state_info, cisco.vni-oper-state_info) with the human-readable enum string carried in a value dimension. Numeric leaves - hold-time, counters, cp-vnis - map directly to gauge-style metric names without _info.
Time series and rollups. Each unique combination of metric name + dimensions forms one series. mstats aggregates across time (latest, count, sum, avg) and groups with BY - the primary query command for Dashboard Studio panels in this app. Use span= for chart resolution when plotting trends.
mcatalog - discovery. Before writing SPL, mcatalog lists which metric names and dimensions exist in the index - useful when validating a new xpath landed after a subscription change:
| mcatalog values(metric_name) WHERE `evpn_index` "cisco.encoding_path"="Cisco-IOS-XE-nve-
oper:nve-oper-data/nve-oper/nve-peer-oper"
| mcatalog values(*) WHERE `evpn_index` metric_name=cisco.cp-vnis.
Macros and enrichment. The reference app wraps repeated patterns:
Run `evpn_lookup` only after an mstats that groups by cisco.node_id; it renames that dimension to hostname and enriches with inventory fields so panels can filter where role="leaf" without hard-coding device lists.
Overlay oper-state is numeric, high-cardinality, and time-series by nature - a metrics index with mstats rollups fits fabric scorecards and sub-minute flap detection better than ad-hoc index= searches on event data.
Investigation Framework Design
Rapid restoration depends on triage order. Jumping to leaf BGP CLI before confirming fabric-wide posture is a common mistake that burns minutes during an incident.
The reference design enforces a three-layer sequence:
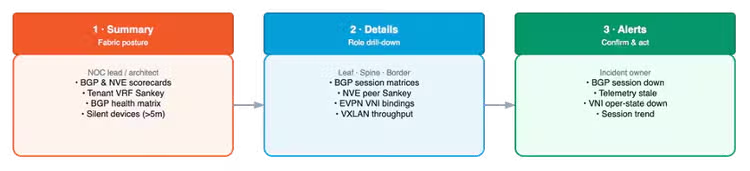
Three-layer investigation framework
Designed triage path: Summary → (red / non-zero) → Details (pick role) → Alerts (confirm). The dashboard panels that implement each layer are described next.
Dashboard Architecture
Summary - Fabric Posture (Go / No-Go)
The Summary view answers whether the overlay is converged before any device-level drill-down. Panel rows rollup all devices across NVE VNIs, BGP sessions, VTEP peers, active L2/L3 VNIs, and silent devices (no telemetry heartbeat). When every ▼ counter reads 0 and Silent reads 0, the overlay is converged. Any non-zero tile identifies which plane warrants investigation—data (NVE), control (BGP), or ingestion (silent stream)—without CLI.
Scorecards

Summary scorecards - fabric go/no_go tiles
BGP Trends and Tenant VRFs
Established-session trends show control-plane stability; the tenant VRF Sankey maps which fabric roles host which overlay segments—useful for shift handoff when a tenant-specific fault is reported.
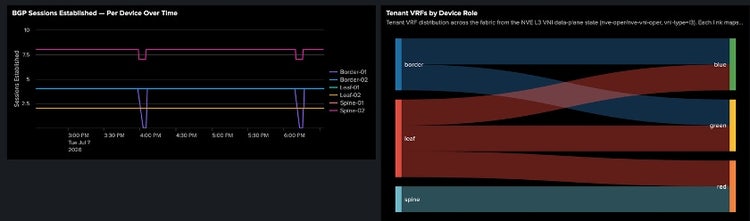
Summary - BGP established trends and tenant VRF Sankey
BGP Session Health Matrix
When BGP scorecards are non-zero, the BGP session health matrix presents device × neighbor state in one grid. A single red cell isolates the failing adjacency—spine reflector, leaf uplink, or border peering—before engineers engage the wrong tier.
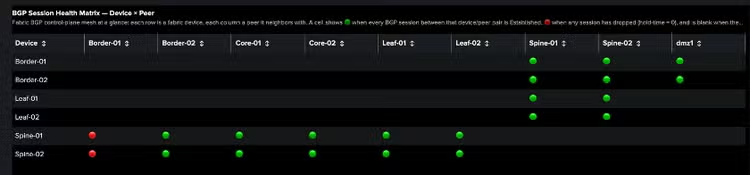
Summary - BGP session health matrix
NVE Overlay Counts
Per-device VTEP peer and VNI counts validate overlay inventory against the expected role design (leaves carry L2/L3 VNIs; spines reflect; borders concentrate L3 egress).
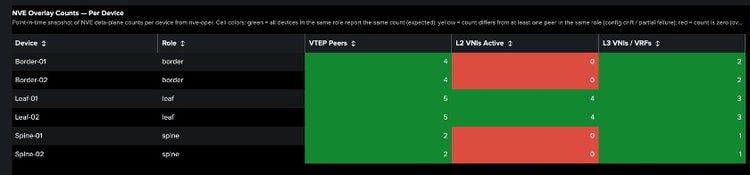
Summary - per-device NVE overlay counts
Details - Role-Based Drill-Down
After Summary identifies which plane is abnormal, the Details view filters by Fabric Node Role:
- Leaf - L2+L3 VNI faults, access-side BGP, VTEP peer Sankey
- Spine - route-reflector peering, EVPN instance churn
- Border - tunnel oper-state, L3 handoff, WAN-facing BGP
Sankey visualizations expose Device → VNI → VTEP peer adjacency without manual topology drawing.
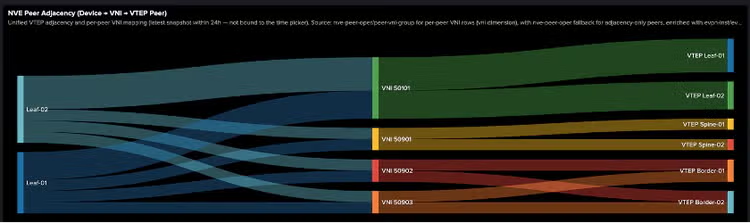
Details - NVE peer adjacency Sankey (leaf role)
Alerts - Derived Fault Worklist
The Alerts view is a derived worklist—not saved Splunk Enterprise notable events—built from the same metrics index:
- BGP session down (CRITICAL) - peer, VRF, hostname
- Telemetry stale (HIGH) - device silent > 5 minutes
- VNI oper-state down (HIGH) - segment impact
Each row includes trend context over the selected time range to distinguish a flapping peer from a hard down.
Query Model - Representative SPL Patterns
Dashboard panels encode the assurance logic in SPL. These patterns illustrate how overlay health maps to mstats against the metrics index.
BGP EVPN sessions not established – any neighbor with hold-time 0 is overlay risk:
| mstats latest("cisco.negotiated-keepalive-timers.hold-time") AS hold_time
WHERE `evpn_index`
"cisco.encoding_path"="Cisco-IOS-XE-bgp-oper:bgp-state-data/neighbors/neighbor"
BY "cisco.node_id", "vrf-name", "neighbor-id"
| `evpn_lookup`
| where hold_time==0
| table hostname role site vrf-name neighbor-id hold_time
Devices that stopped streaming – a green BGP panel means nothing if the switch went silent:
| mstats latest(_time) AS last_seen
WHERE `evpn_index`
("cisco.encoding_path"="Cisco-IOS-XE-nve-oper:nve-oper-data/nve-oper"
OR "cisco.encoding_path"="Cisco-IOS-XE-bgp-oper:bgp-state-data/neighbors/neighbor")
BY "cisco.node_id"
| `evpn_lookup`
| eval silent_sec = now() - last_seen
| where silent_sec > 300
| table hostname role site silent_sec
NVE VNIs in oper-down state – data-plane segment impact:
| mstats latest("cisco.vni-oper-state_info") AS vni_state
WHERE `evpn_index`
"cisco.encoding_path"="Cisco-IOS-XE-nve-oper:nve-oper-data/nve-oper/nve-vni-oper"
BY "cisco.node_id", vni
| `evpn_lookup`
| where vni_state=0
| stats count AS down_vnis BY hostname role
Summary: What Changes for Splunk Enterprise Operators
Campus BGP EVPN fabrics are distributed systems. Assuring them requires overlay-aware telemetry, not interface polls alone. When you stream Cisco Catalyst 9000 IOS-XE Operating System MDT into a Splunk Enterprise metrics index and layer Summary → Details → Alerts dashboards on top, you gain:
- Fabric-wide posture in one glance at shift start
- Peer-level isolation before CLI on the wrong device
- Durable evidence of flaps and reconvergence events that clear before tickets escalate
- Closed-loop assurance - faults inform design updates in Cisco Catalyst Center
That is how Splunk Enterprise practitioners extend observability from applications and cloud into the campus fabric that carries them.
Related Reading
Related Splunk Lantern articles in this observability space:
Monitoring MPLS backbone infrastructure in real time
A reference implementation of this architecture - including the campus_evpn_assurance app for Splunk Enterprise and OTel collector configuration - is available on GitHub.
Related Articles

Splunk Observability & Security Weeks - Best Practices for Strong Cyber Resilience and Business Success

When AI Tools Turn Against You: Operationalizing MCP Server Security with the Splunk MCP TA