Observability Blogs
Latest Articles
template
category
category
observability

Full Java Observability in 5 Simple Steps
Learn how DevOps and IT teams are creating observable applications and infrastructure in Java environments with just five easy steps.
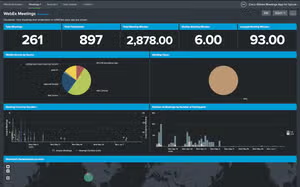
Splunking Cisco Webex Meetings Data
Check out this detailed walkthrough of Cisco Webex Meetings Add-on for Splunk.

Introducing the Splunk Infrastructure Monitoring Terraform Provider
HashiCorp Terraform is a provisioning tool that enables organizations to adopt an infrastructure as code workflow. Using configuration files stored in version control your organization can manage in-house assets or infrastructure in one — or even many — clouds.

Operationalizing HashiCorp Vault: Introducing a New Splunkbase App to Monitor Vault
With Splunk App for HashiCorp Vault, organizations can seamlessly ingest and visualize performance metrics and audit logs in Splunk to investigate, monitor, analyze and act on Vault data across DevSecOps use cases.

6 Top Metrics to Monitor in AWS EBS
Discover how Splunk Infrastructure Monitoring offers a dashboard out of the box that shows you the most important AWS Elastic Block Store (EBS) metrics at a glance.

SAI Something Linux: Monitoring Linux with Splunk App for Infrastructure
Easy infrastructure monitoring for Linux — get started with logs and metrics together in Splunk App for Infrastructure in minutes.

Monitoring Amazon EC2 with Splunk Infrastructure Monitoring
Explore the top 12 challenges of monitoring Amazon EC2 when dealing with larger scale production deployments in part one of this two-part blog series.

12 Top Things to Monitor in Amazon EC2
Despite Amazon EC2 resilience and elasticity, monitoring ongoing objectives requires close tracking of capacity, predictability, and interdependence. Splunk Infrastructure Monitoring offers a dashboard out of the box that shows you the most important EC2 metrics at a glance.

Monitoring Docker Containers: What Does It Take to Get Started?
Operationalizing Docker means more complexity, and greater need for monitoring and alerting on production environments. Learn docker container monitoring best practices.